August 2023 Overview
Reporting on the previous month’s activity and results.
Social Media (Meta)
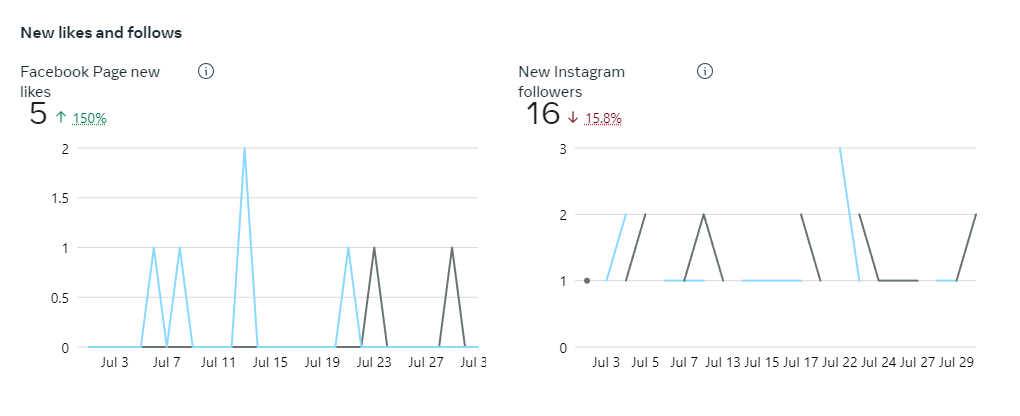
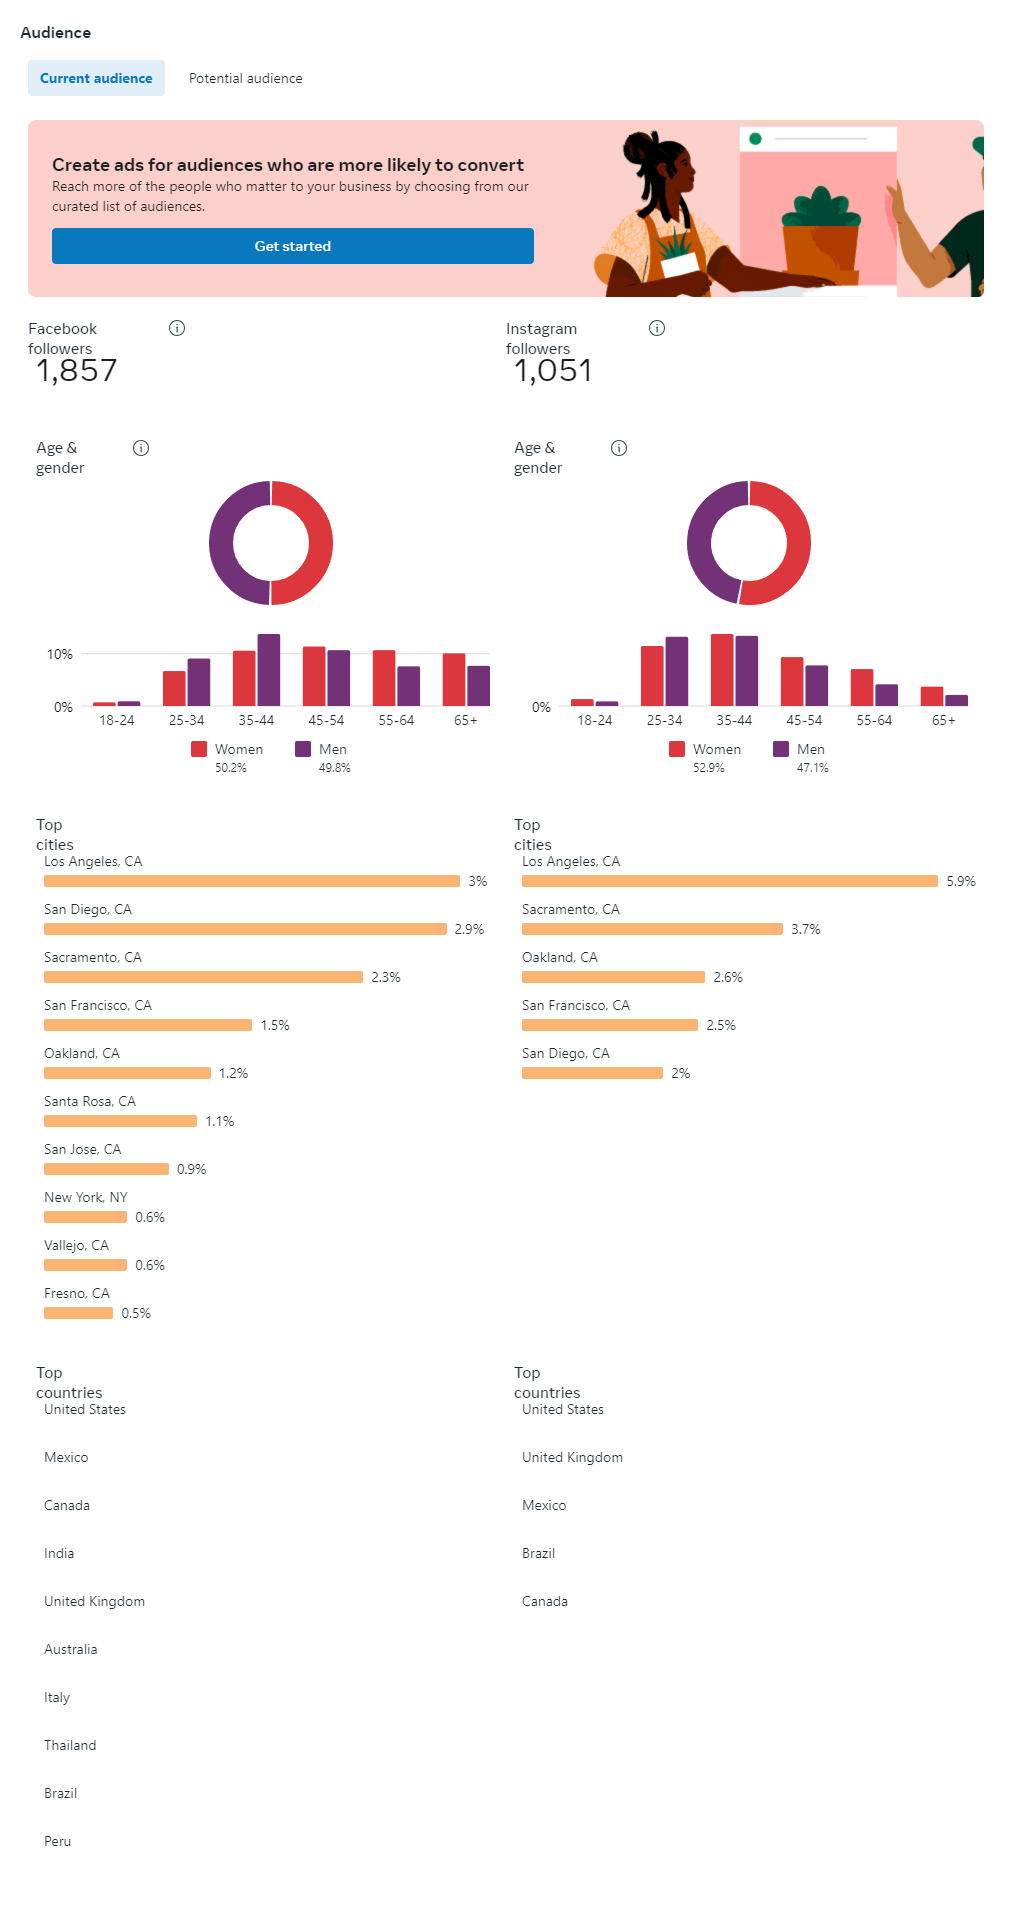
We are up to 1,857 followers on Facebook and 1,051 followers on Instagram.
Our engagement was up 3.4% in July and we had 6 retweets of our conference promotion posts.
Email subscribers
We have migrated over to Network for Good this past month. Still backing up older newsletters
Website visits
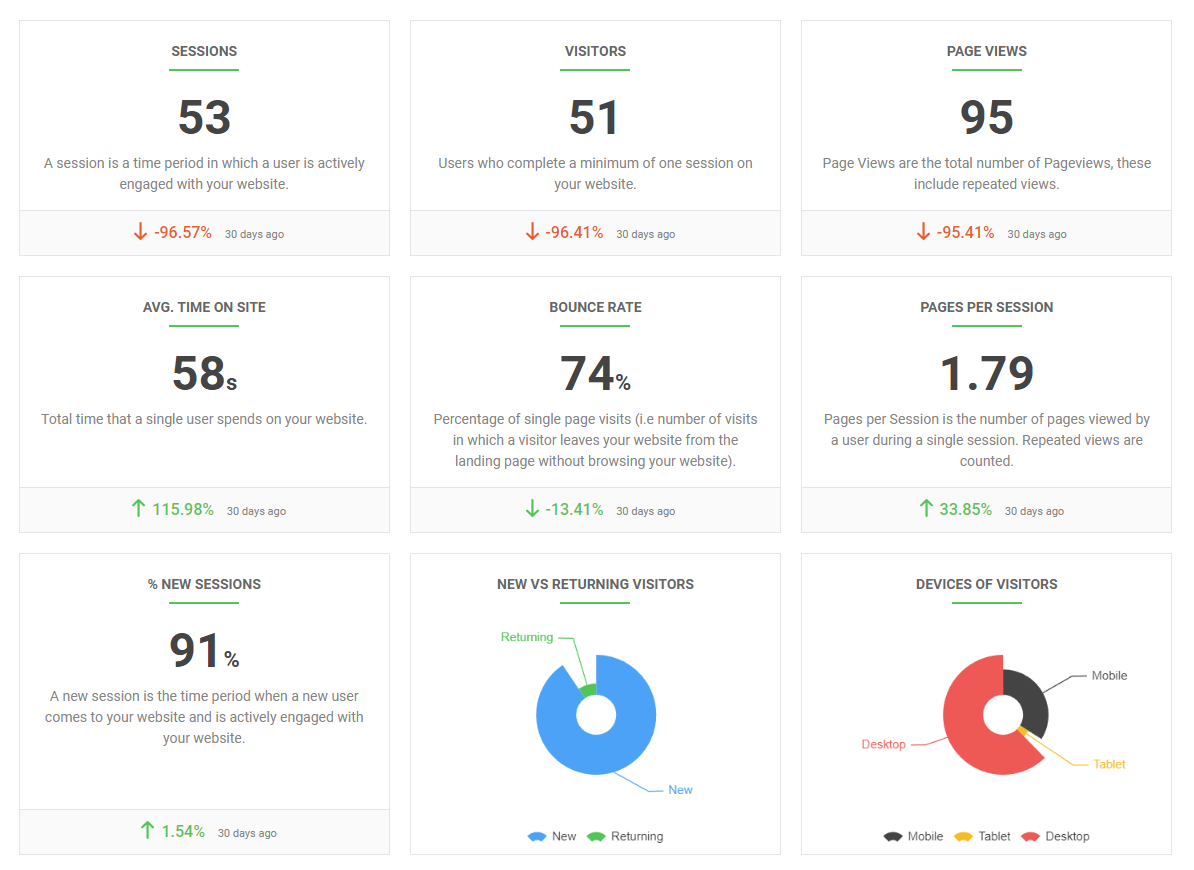
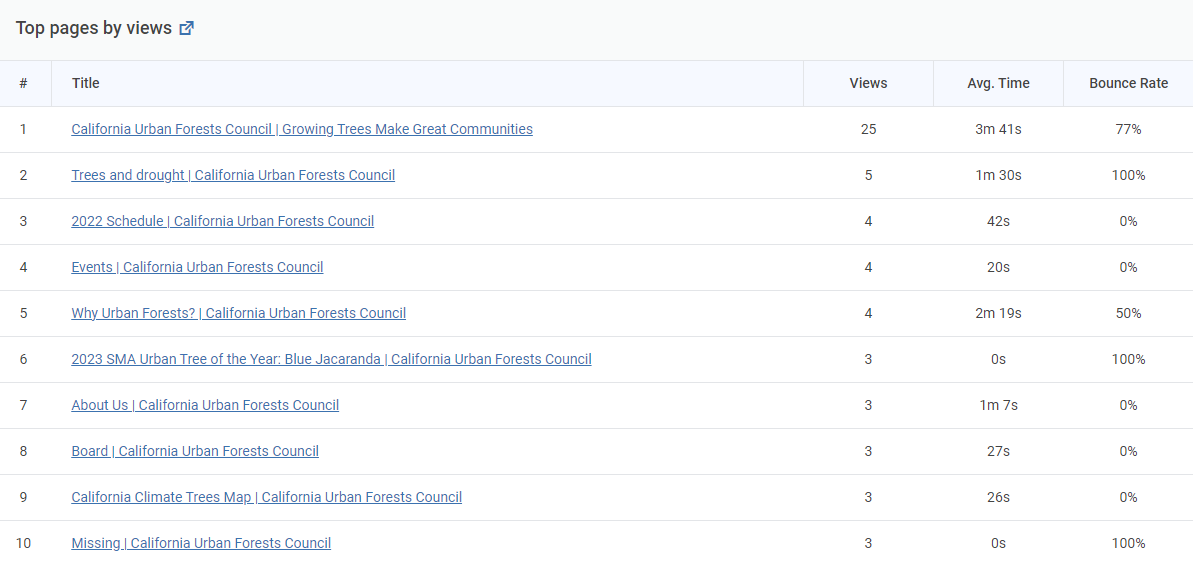
Website visitors were up in June by 68%, and page views up by 35%.
Conference
CAUFC Communications Channels
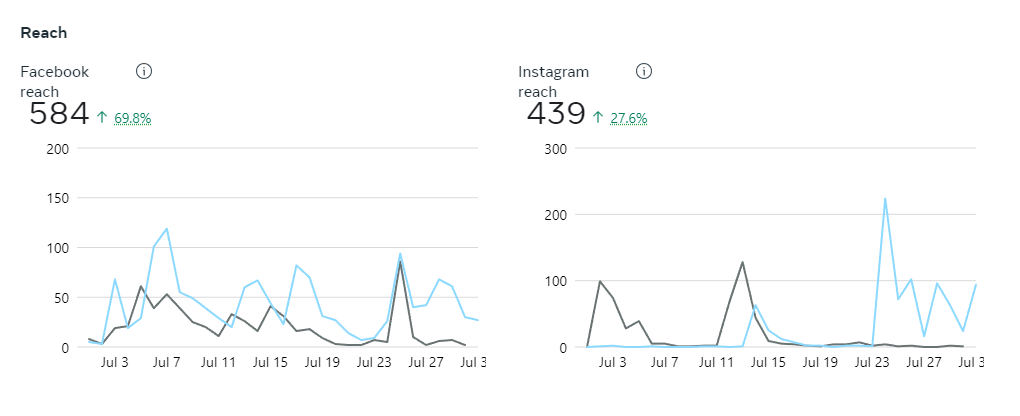
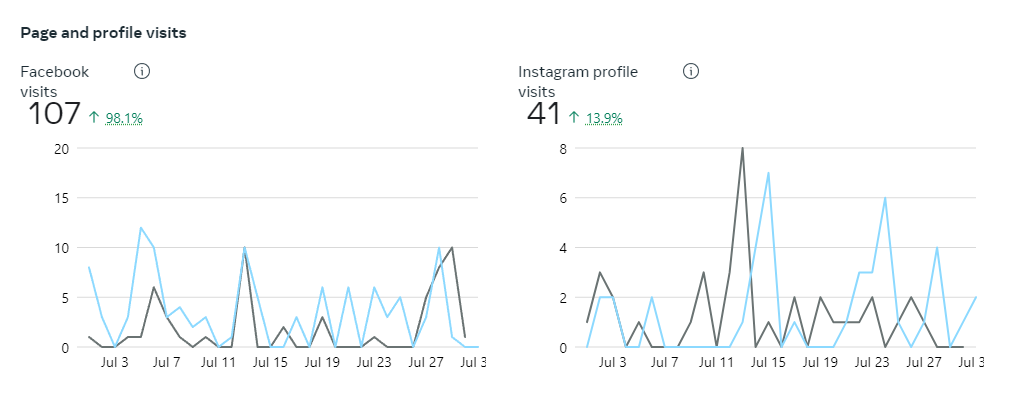
Facebook & Instagram
The blue line shows July activity, and the gray line is the previous month.
Facebook & Instagram Audience
The chart on the right shows our Meta (Facebook and Instagram) audience. You can see our followers and basic demographic information. Our audience has started to move into a younger cohort.
Facebook Content Performance
Facebook reach and engagement are down as we haven’t done boosted posts, and are posting less often.
Instagram Content Performance
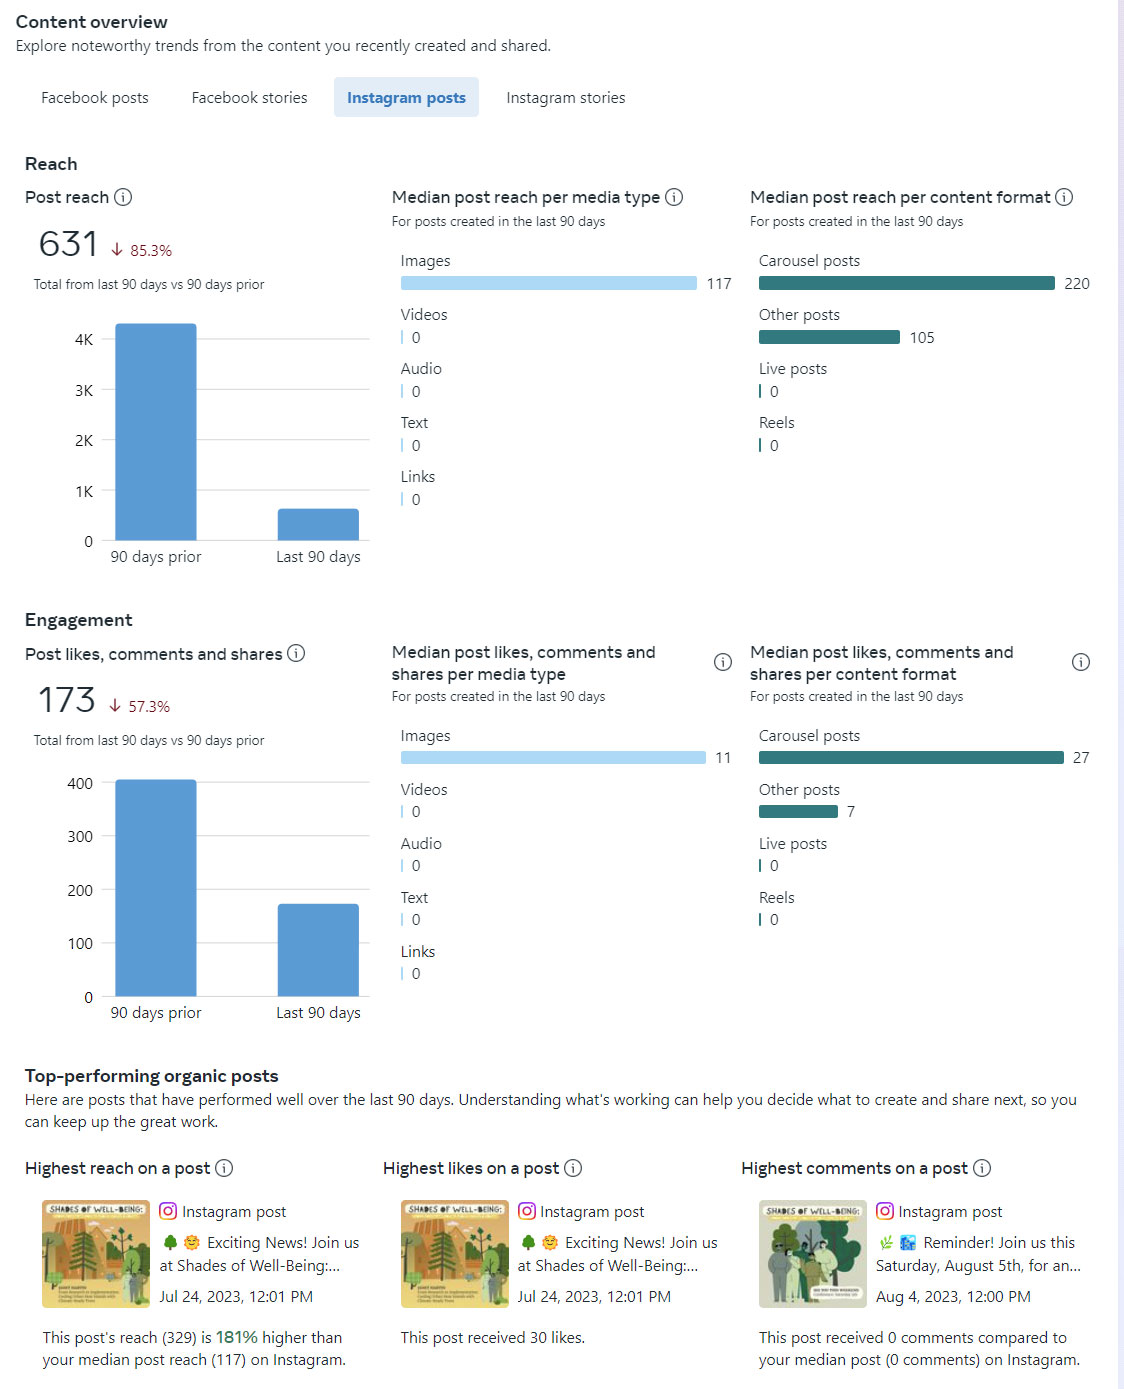
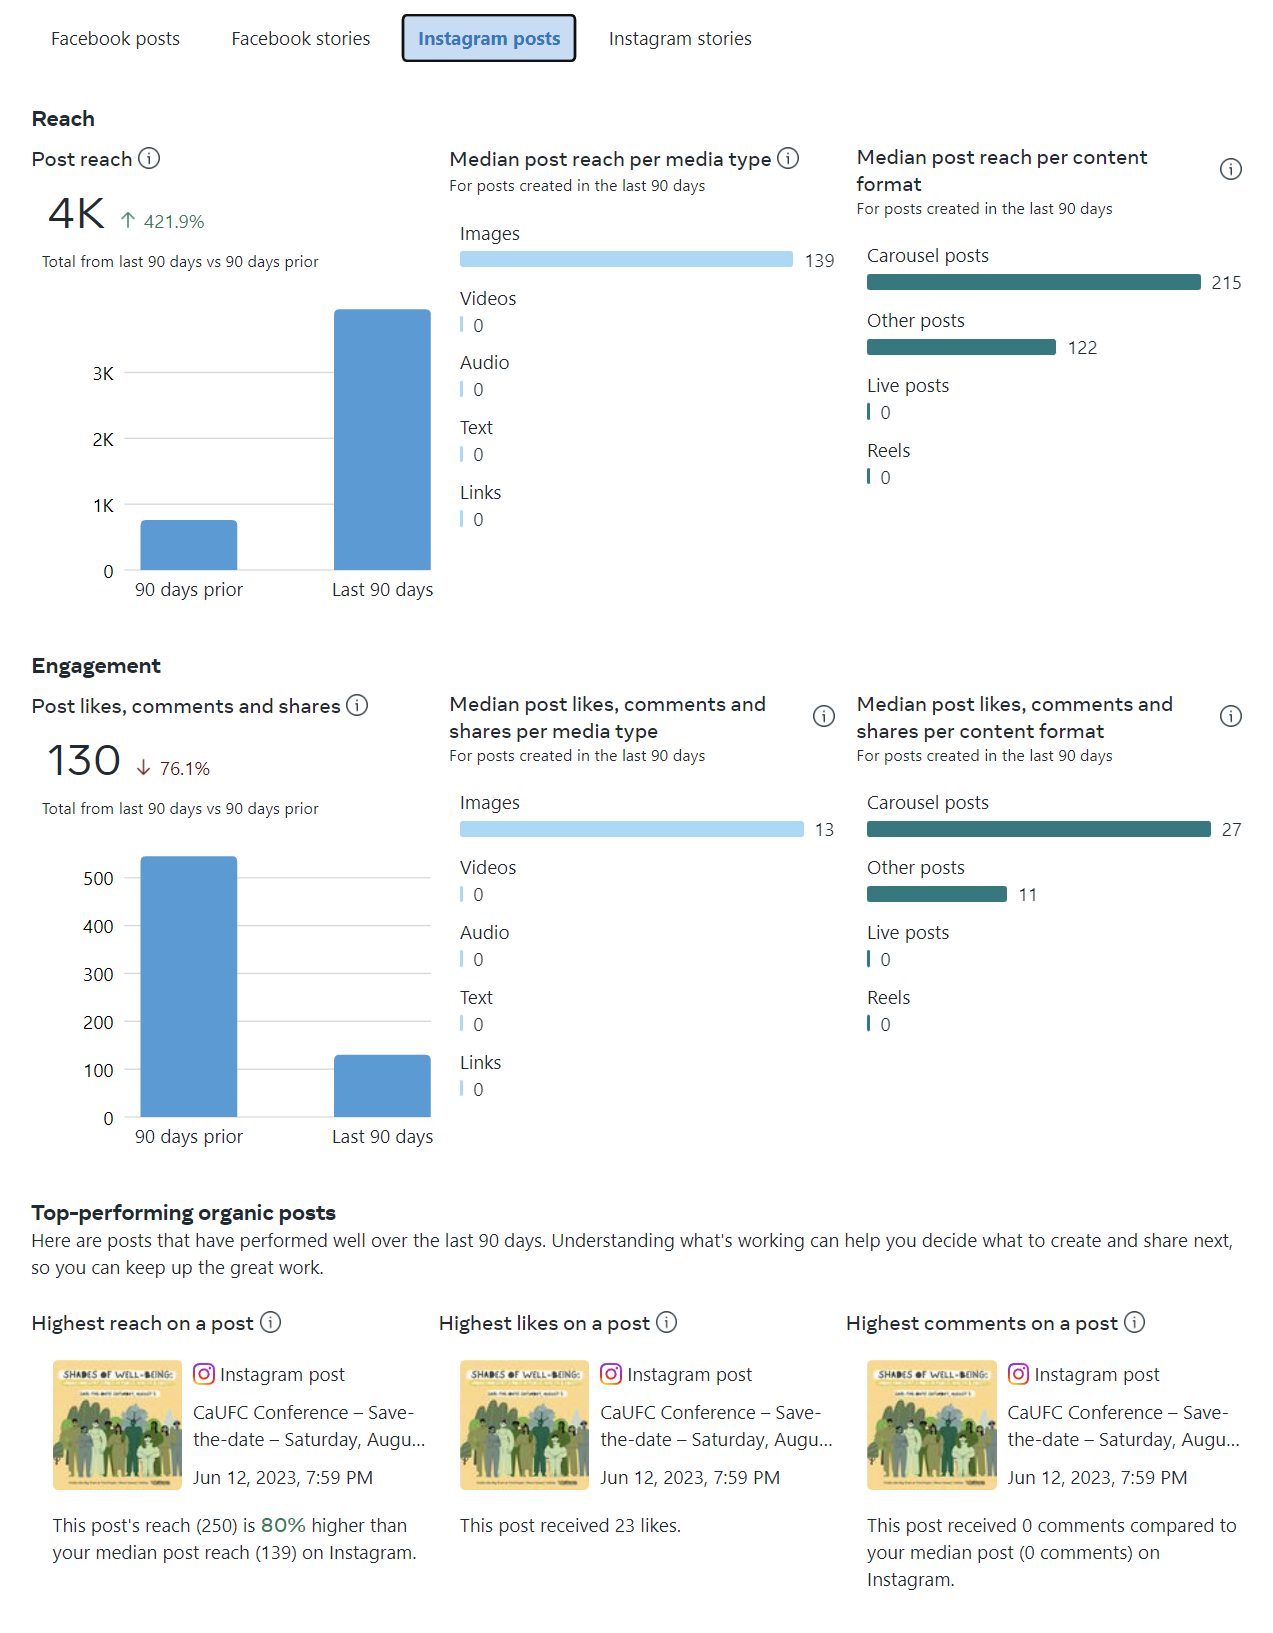
Reach and engagement on Instagram are also down. The content review here shows the last 90 days.
On Twitter, we have 1,198 followers, down two followers. We will be posting more as our conference promotion and other campaigns start rolling out.

Email Audience & Newsletter Performance
CaUFC Master List: 4,630
We have 4,630 subscribers to our email list.
We have sent out the first of a series of emails promoting the conference with a promo code for purchasing tickets. The promo code will help us track possible attendees.
We had an almost 28% open rate.
Our mailing list was cleaned up a number of times, and I will be sending out a number of blasts to check if subscribers that rarely open our emails still want to be on our list. We also do not have details like first names for almost 600 subscribers, which is a required field in Network for Good.
CAUFC Website Performance
July 2023
Highlights
The chart on the right tracks the page views and visitors to the site each month and other vital measurements for the website for the past year.
Google Analytics changed over and it appears it has not been capturing data properly as the site visits in July were down 97%.
Fundraising
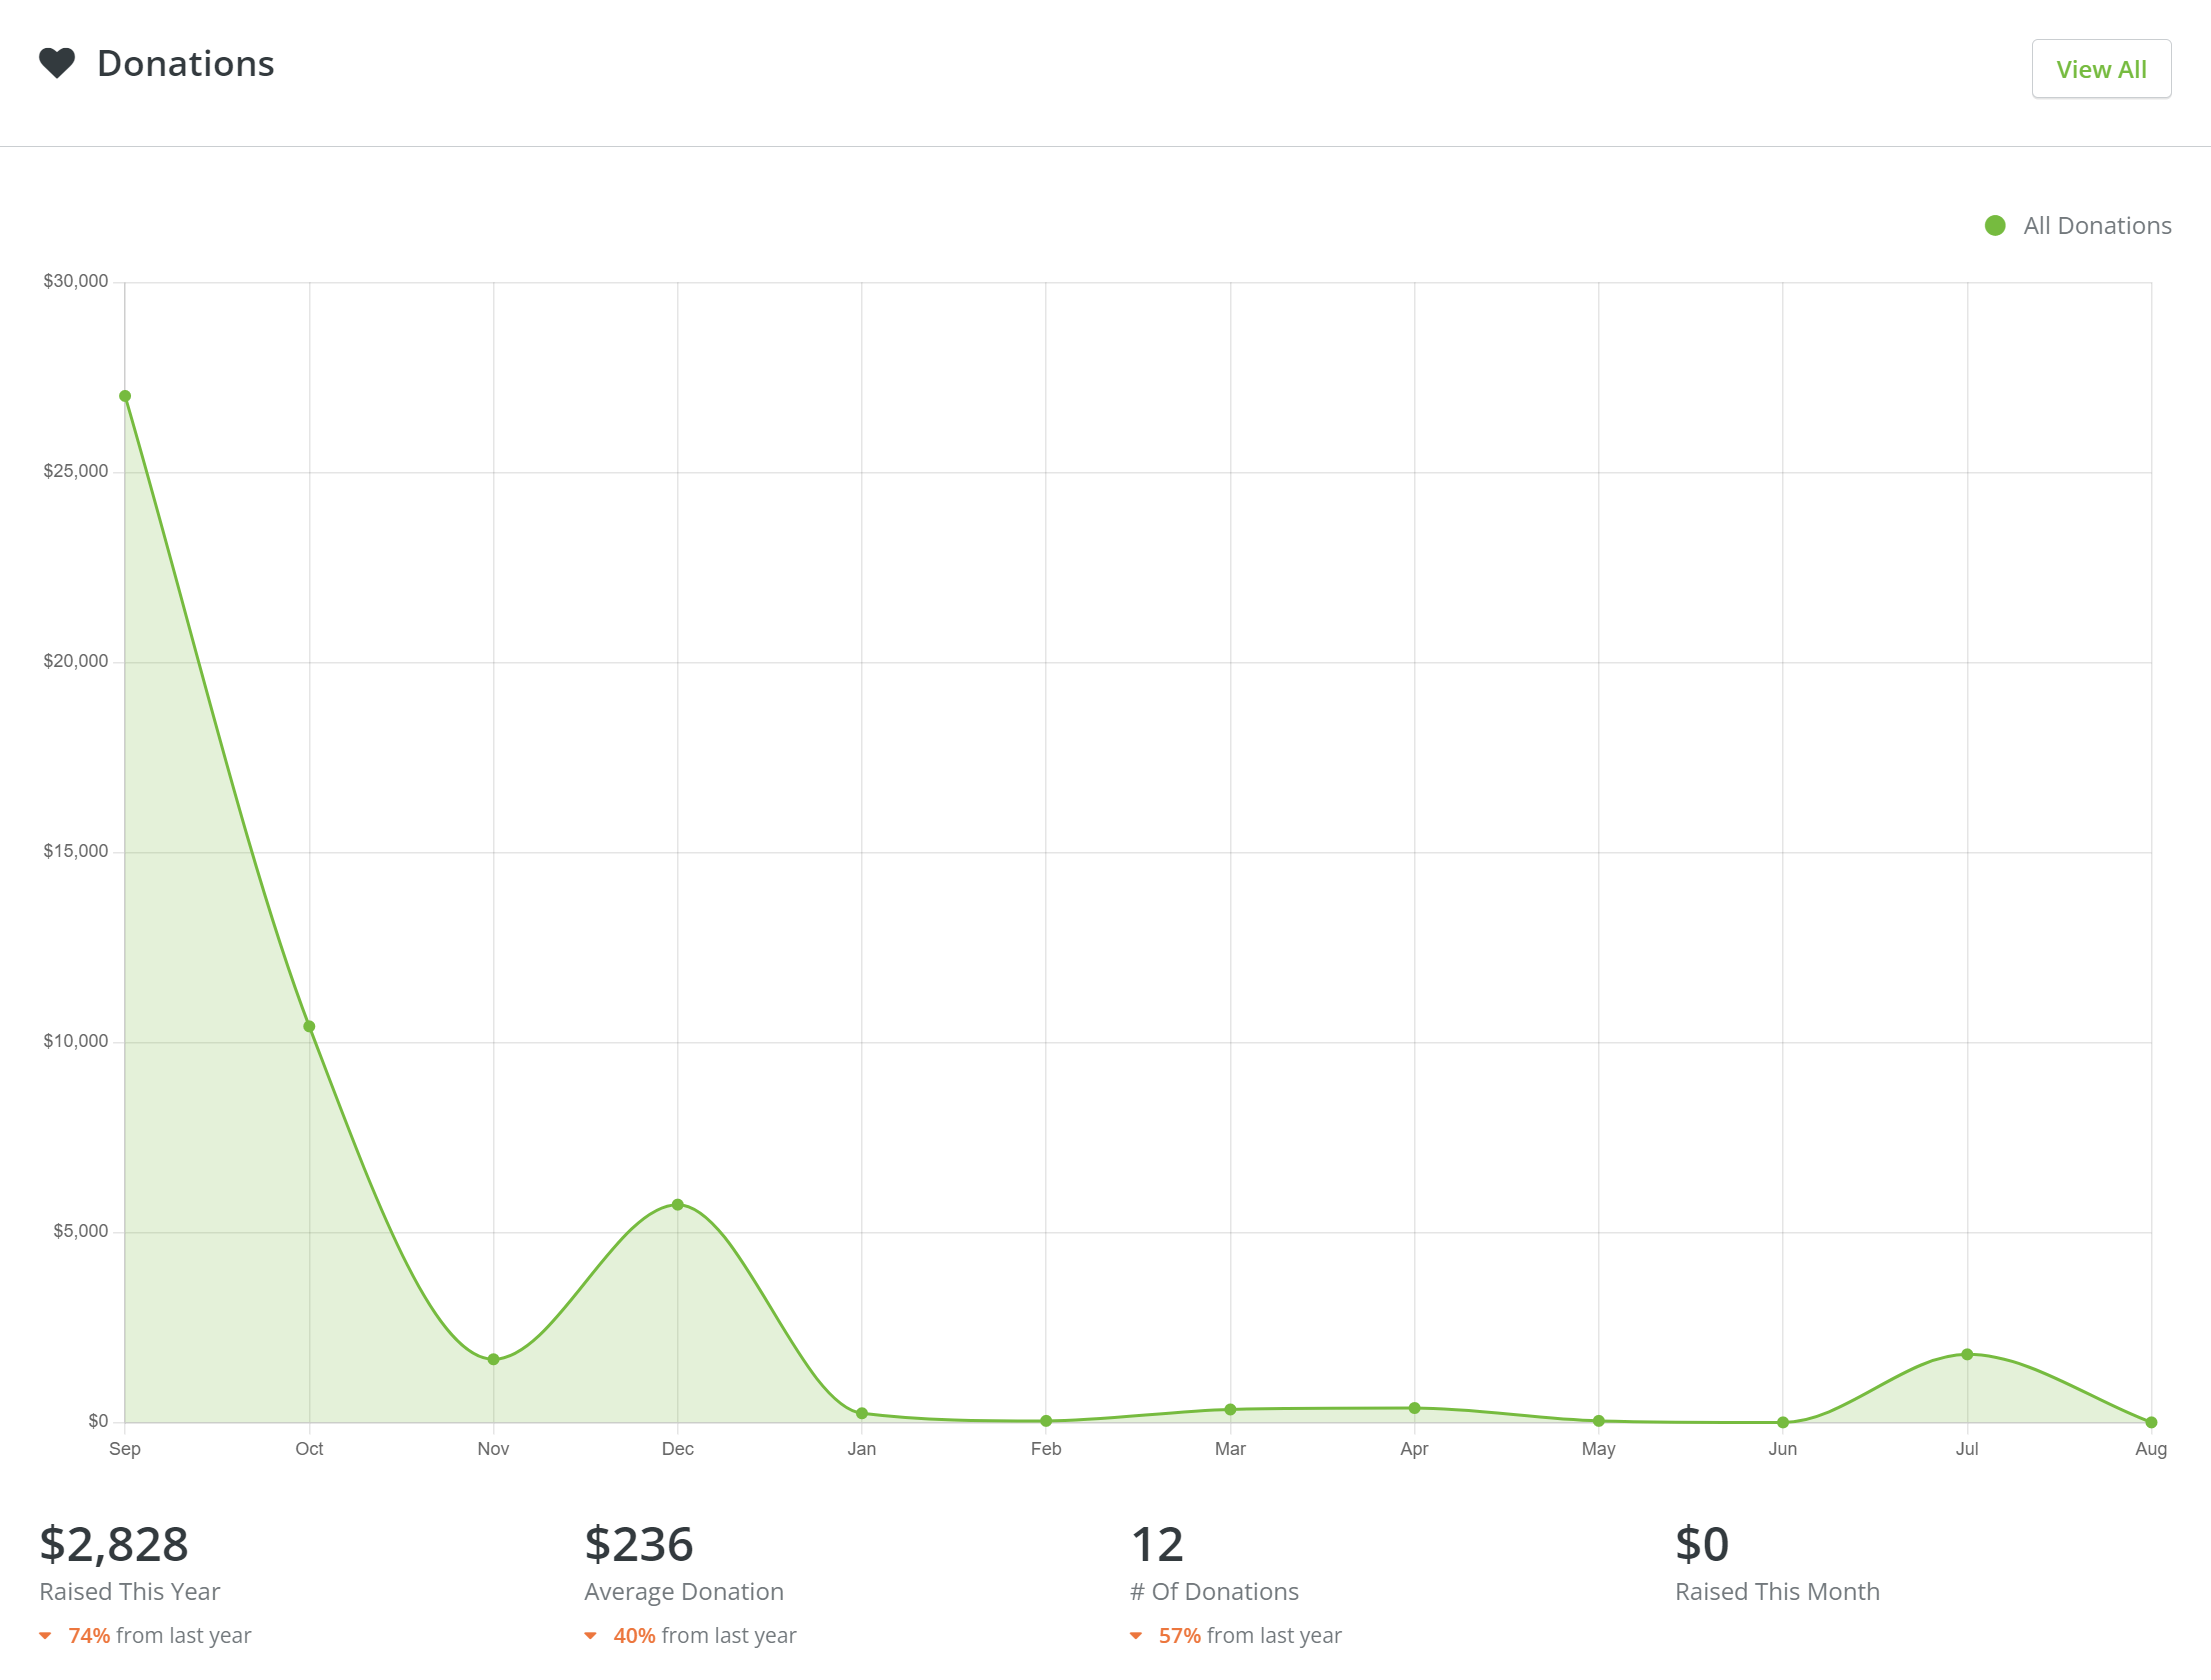
The migration of our donation platform to Network for Good is complete. Our donation page is setup and we are starting to process donations through the platform.
