January 2021
CAUFC Communications Channels
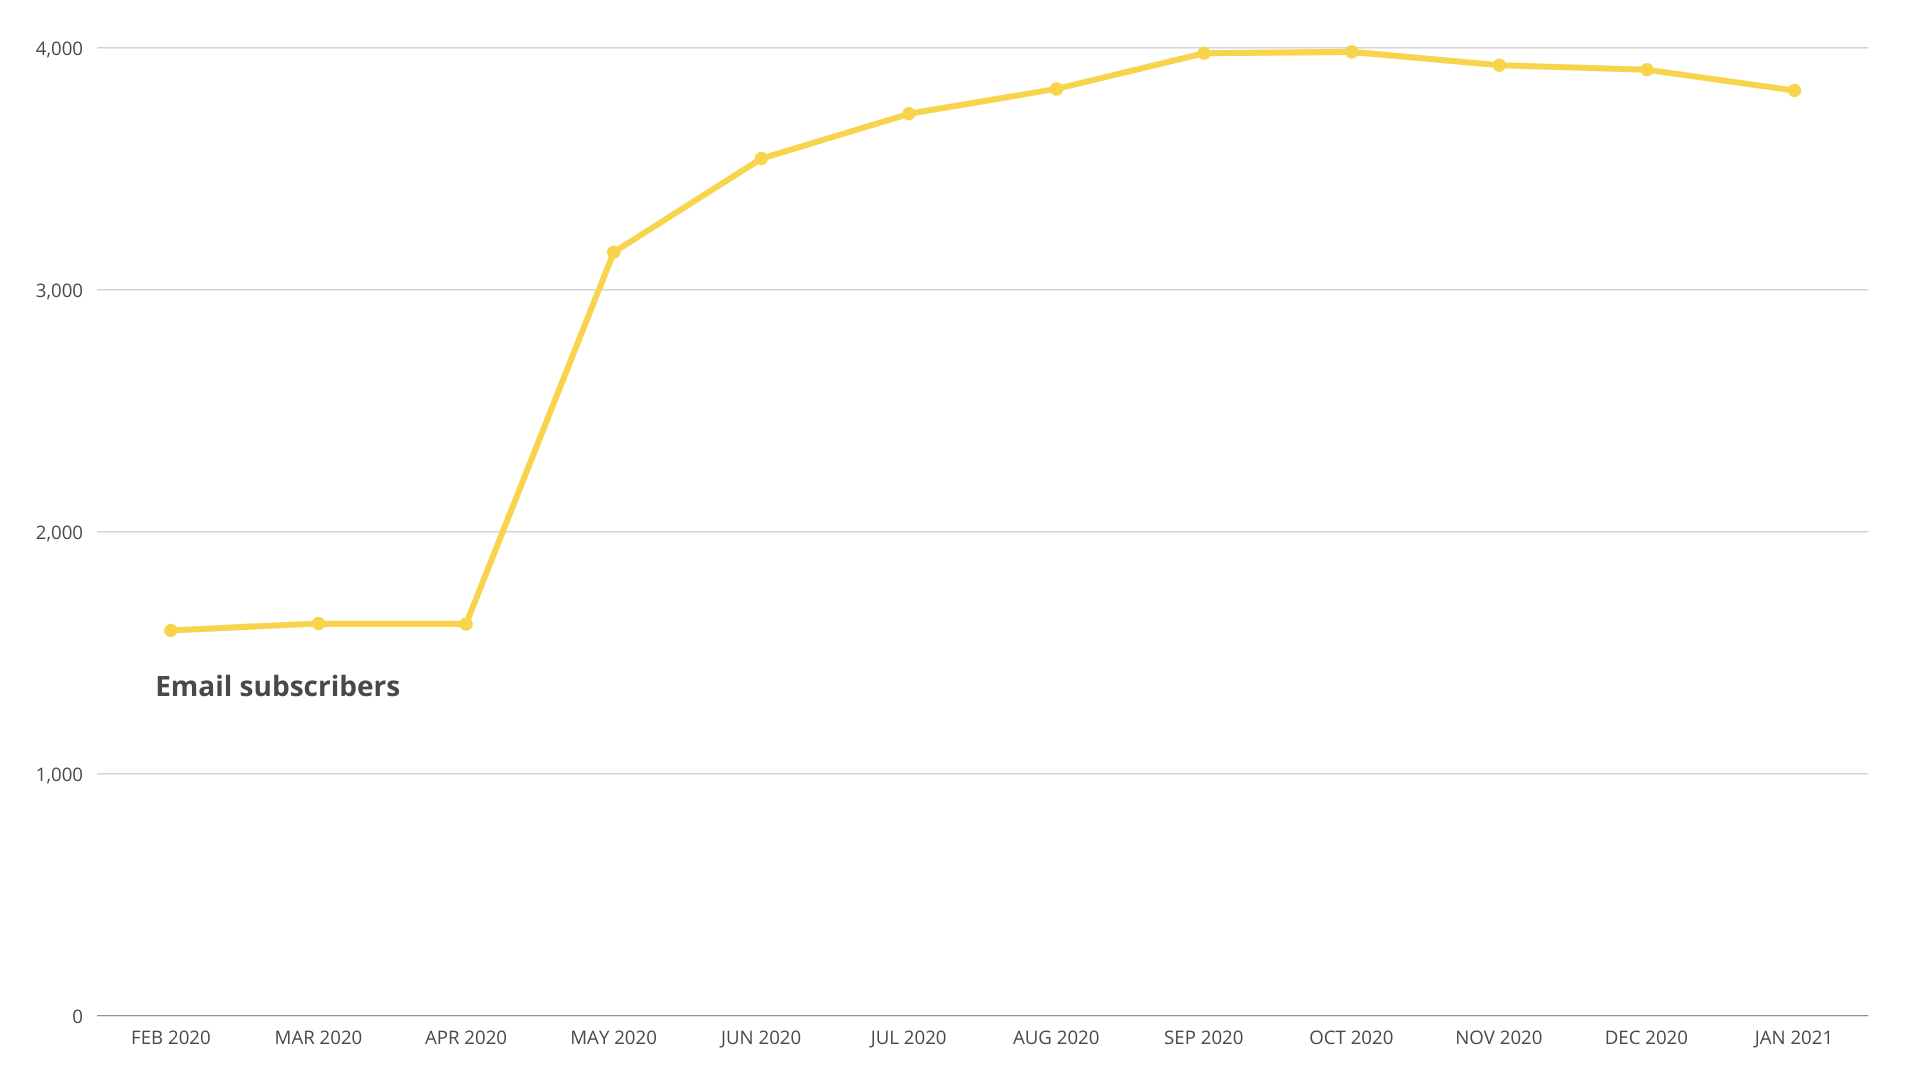
Email subscribers: 3,823
The email subscribers have slightly decreased over the past month.
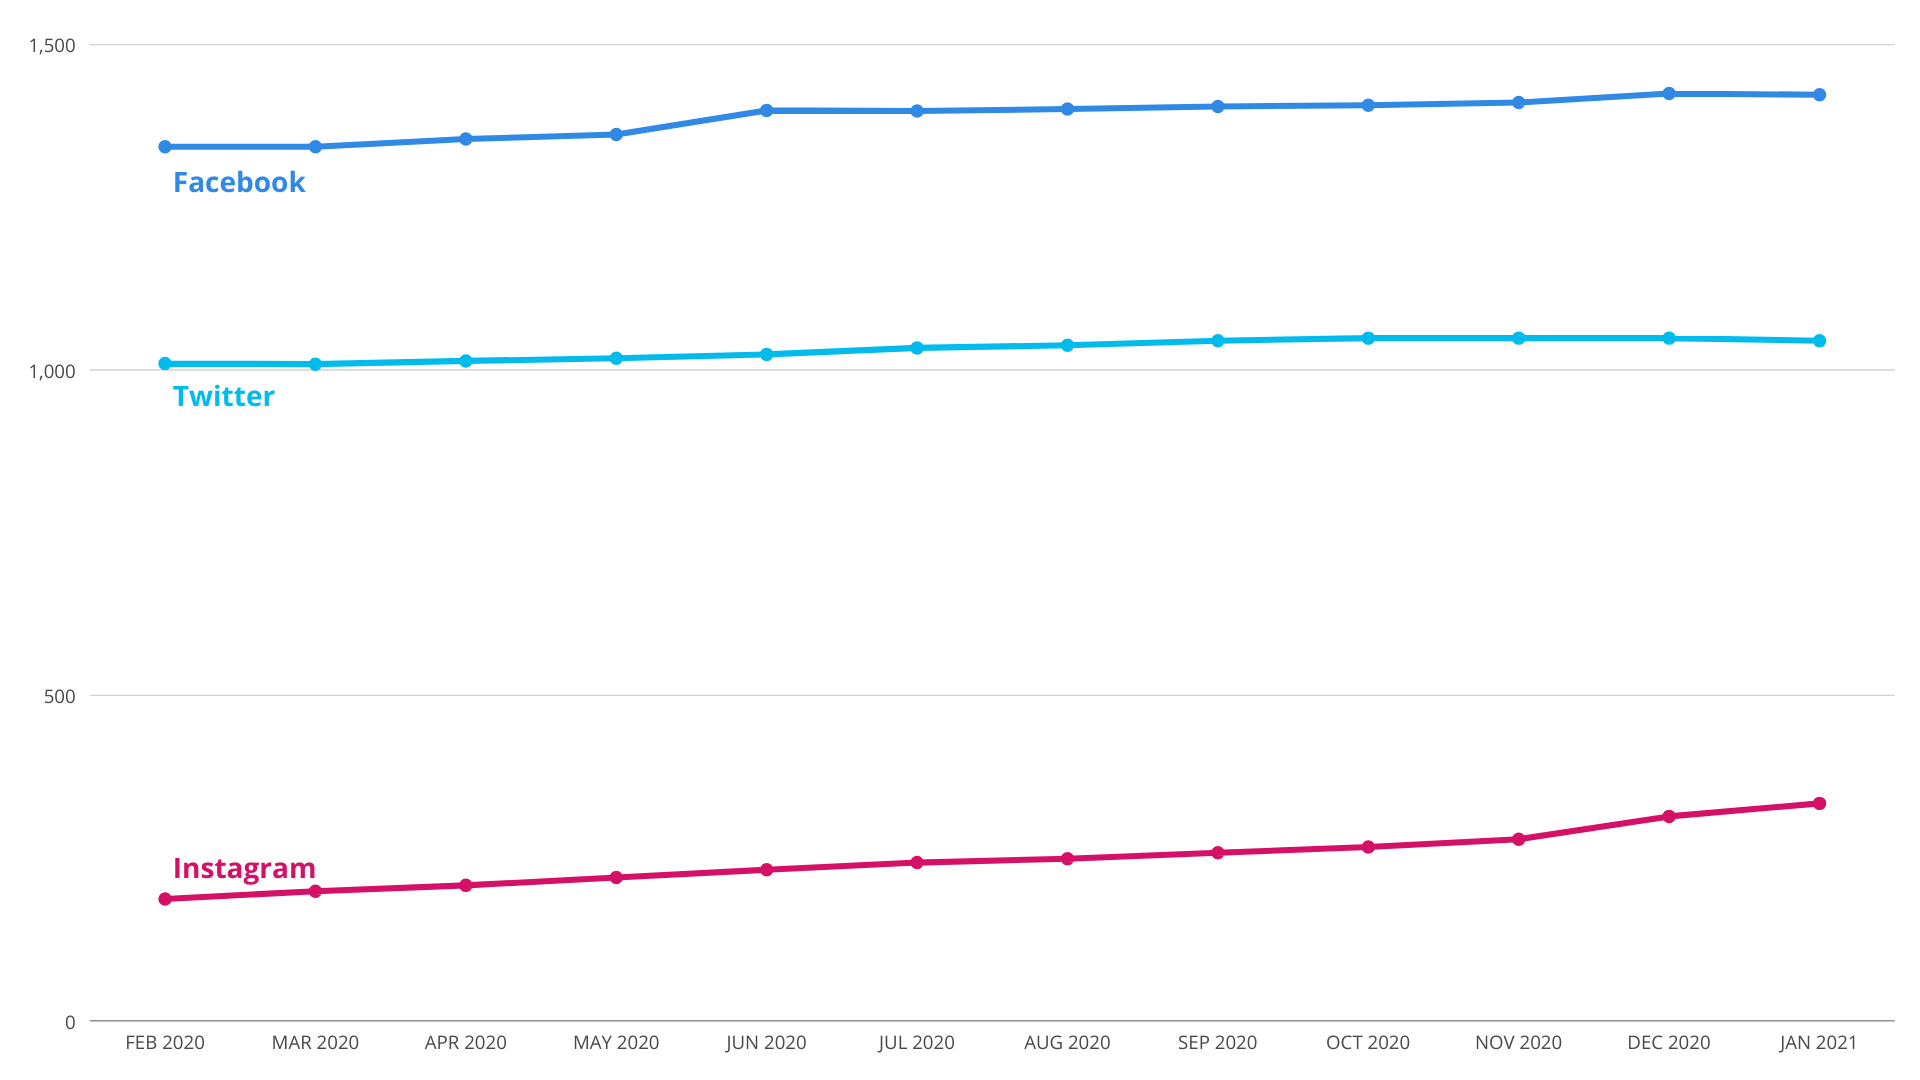
Facebook page followers: 1,423
Twitter: 1,045
Instagram: 334
Facebook followers are flat. Our intern Hannah has been posting regularly to Instagram, and we are showing some good growth in followers there.
Newsletter Performance & Email Audience
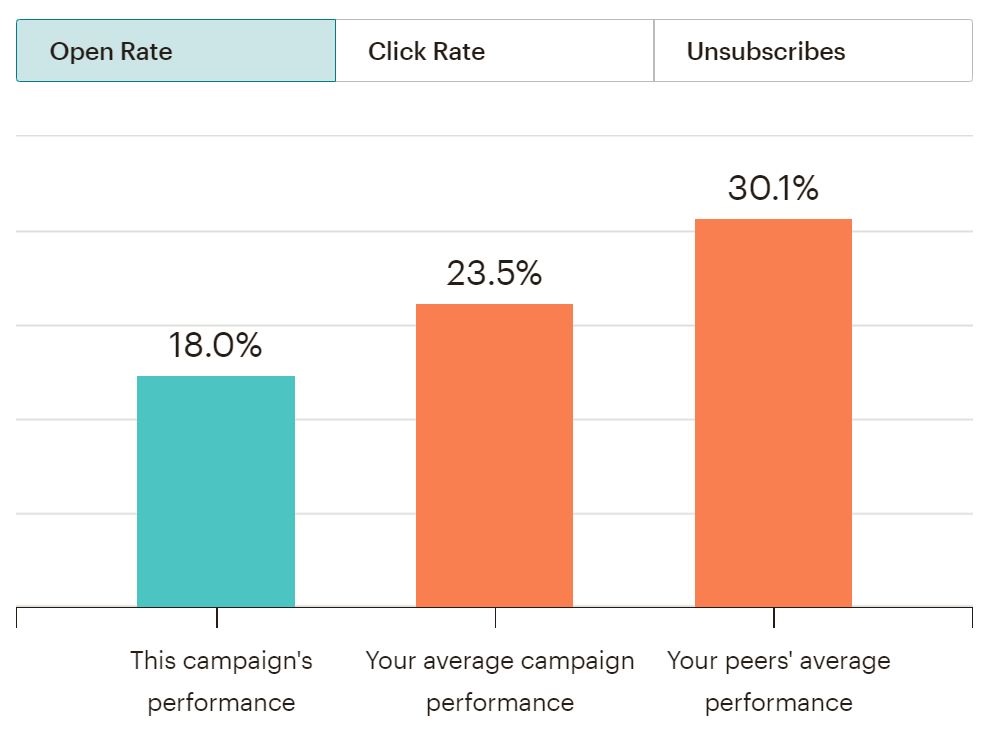
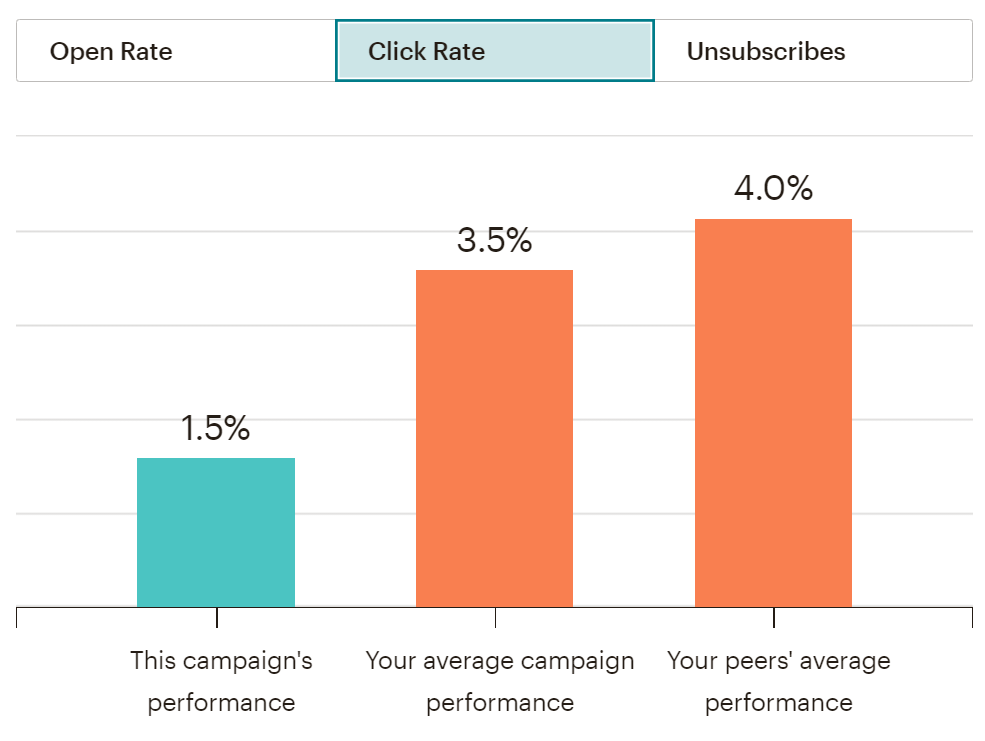
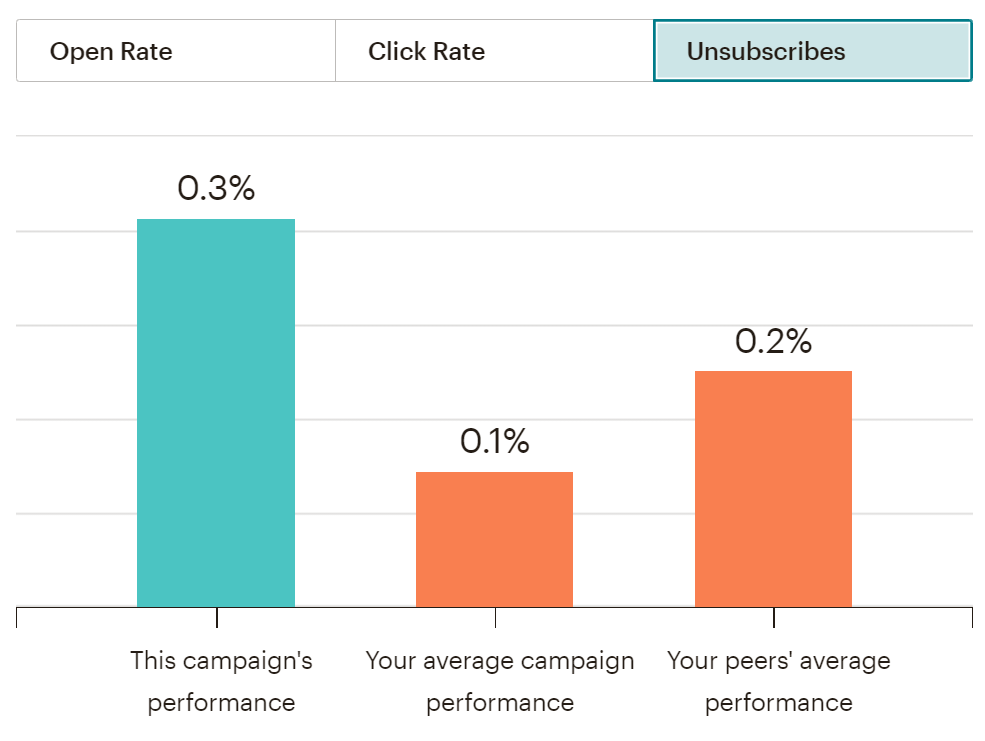
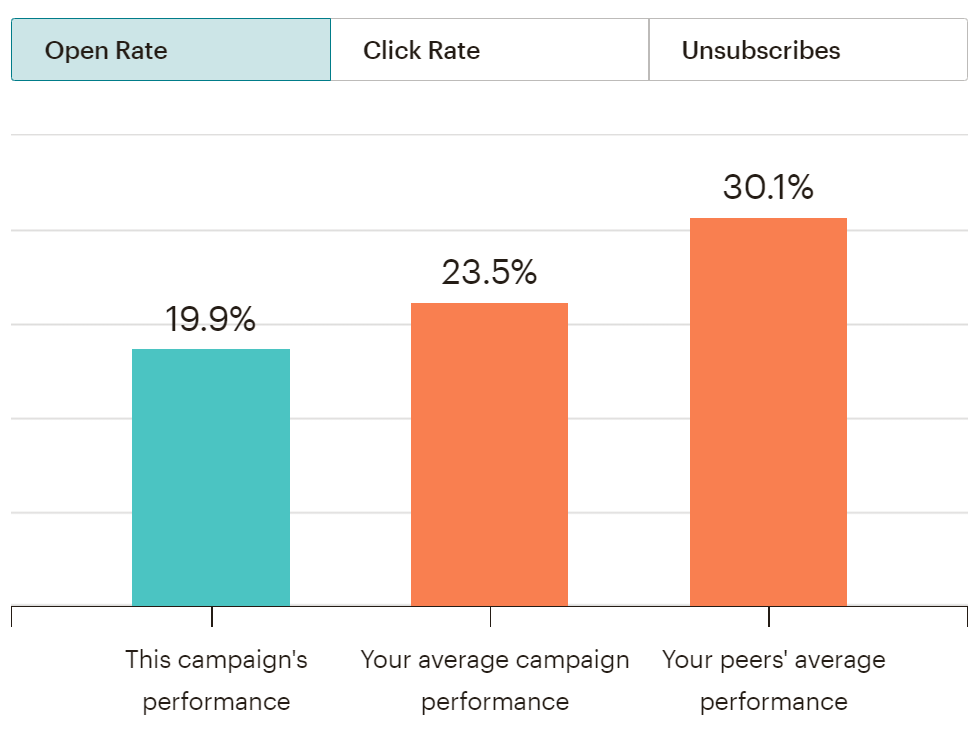
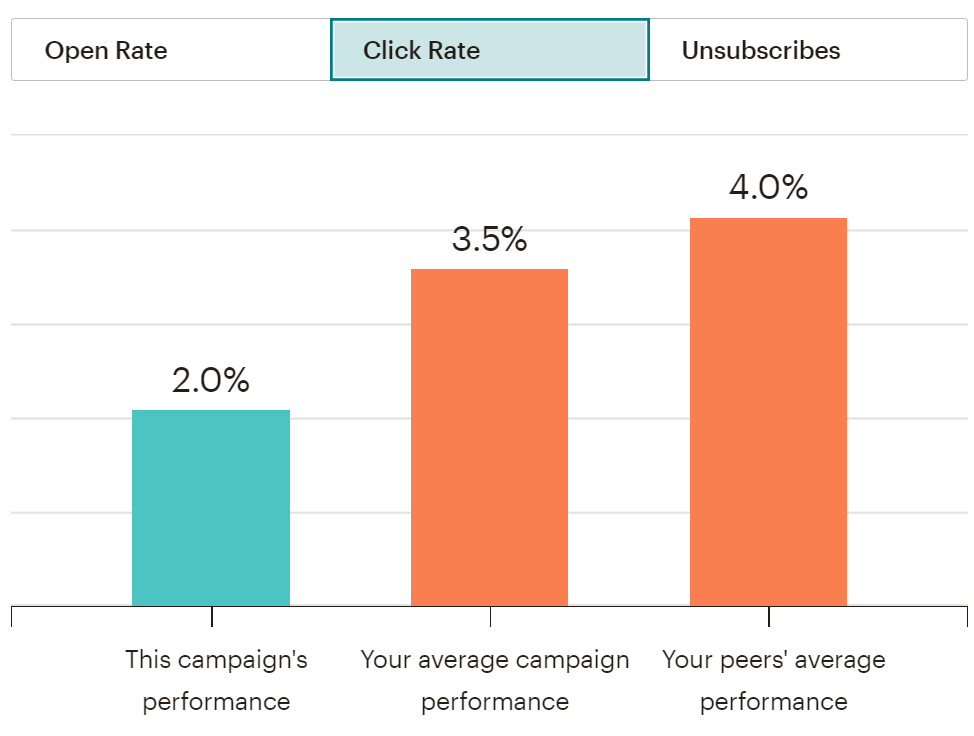
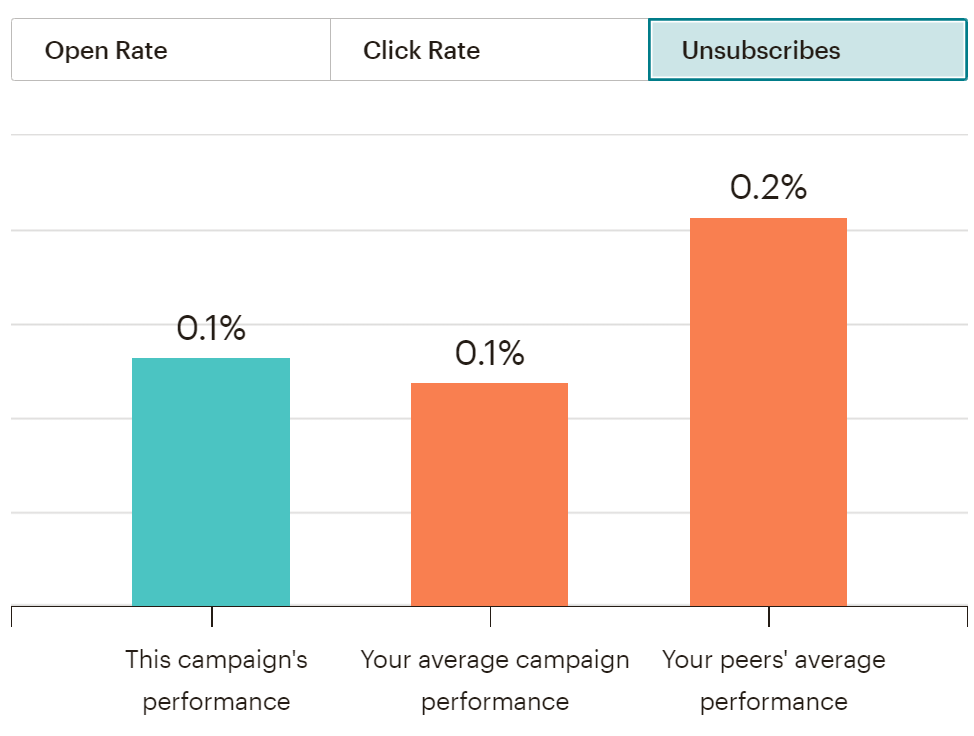
The December and January newsletter performance is shown below.


CAUFC Website Views and Visits
Highlights
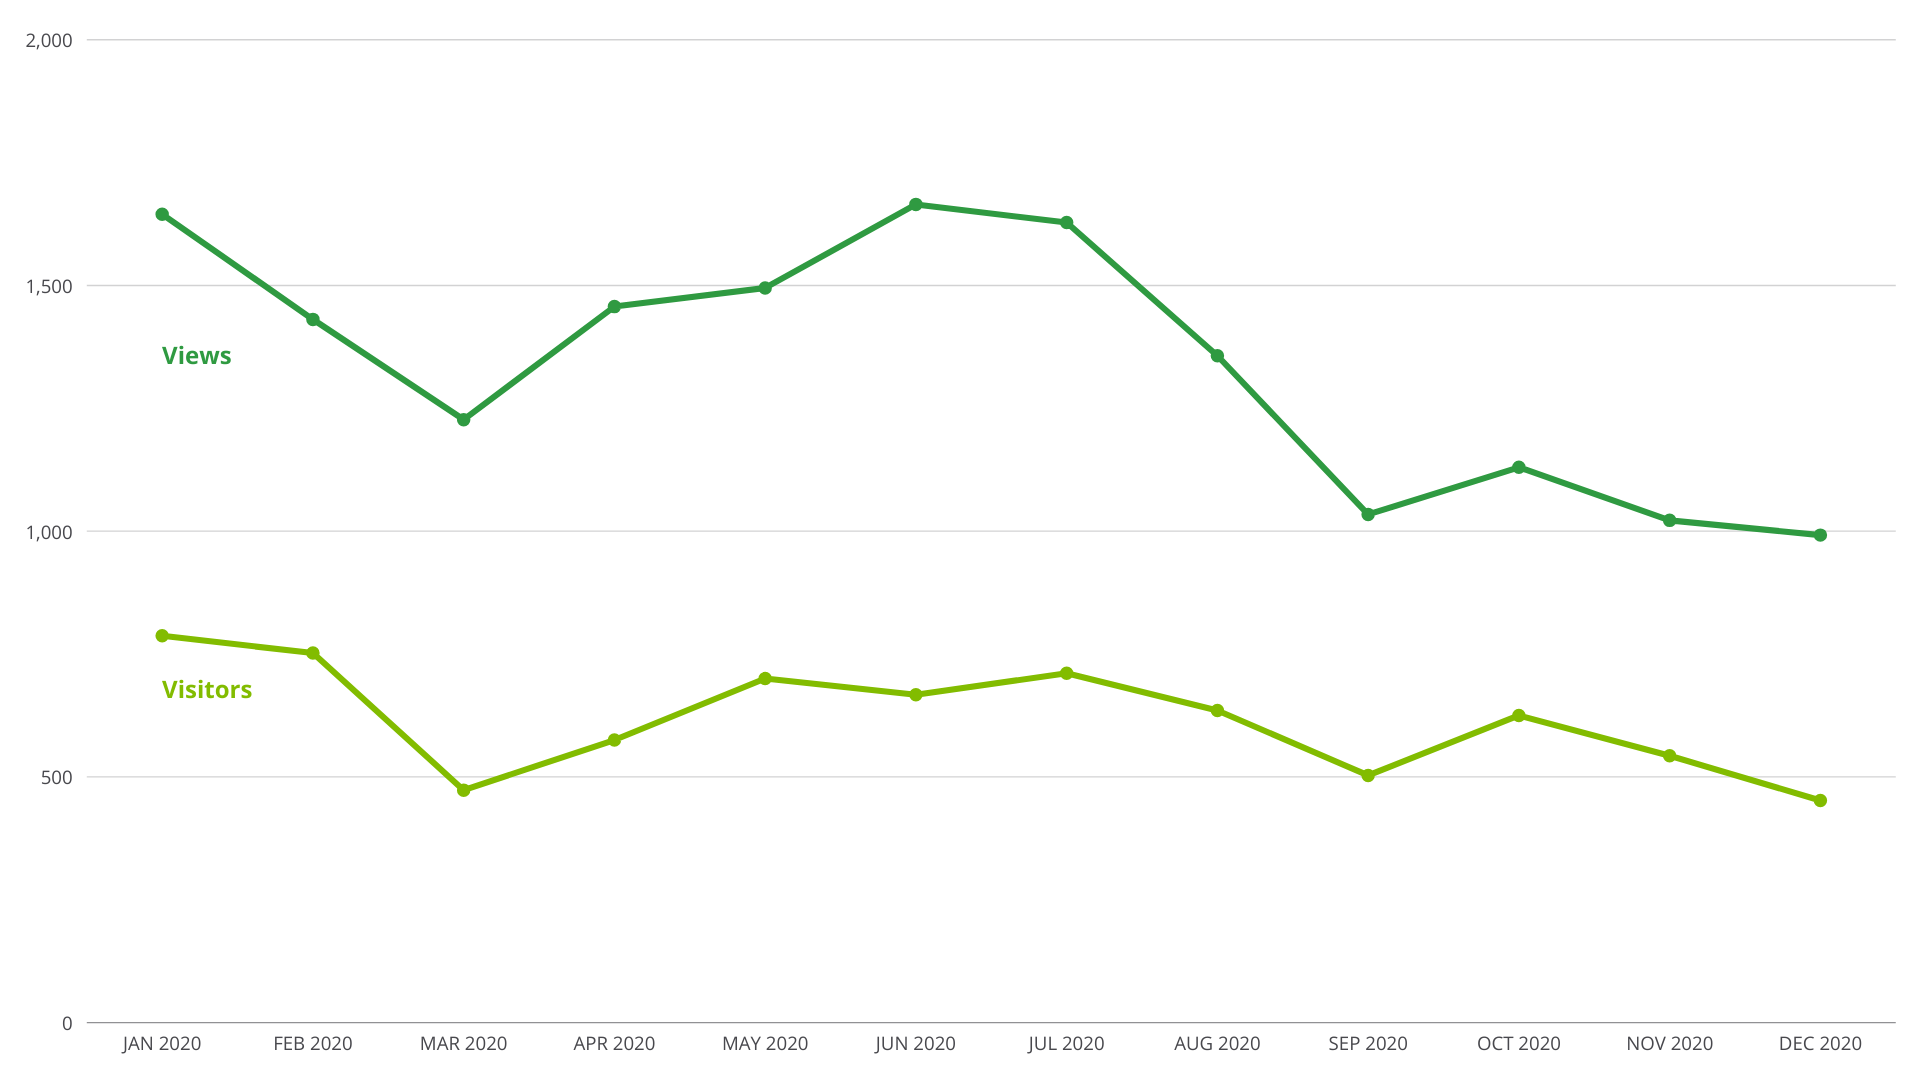
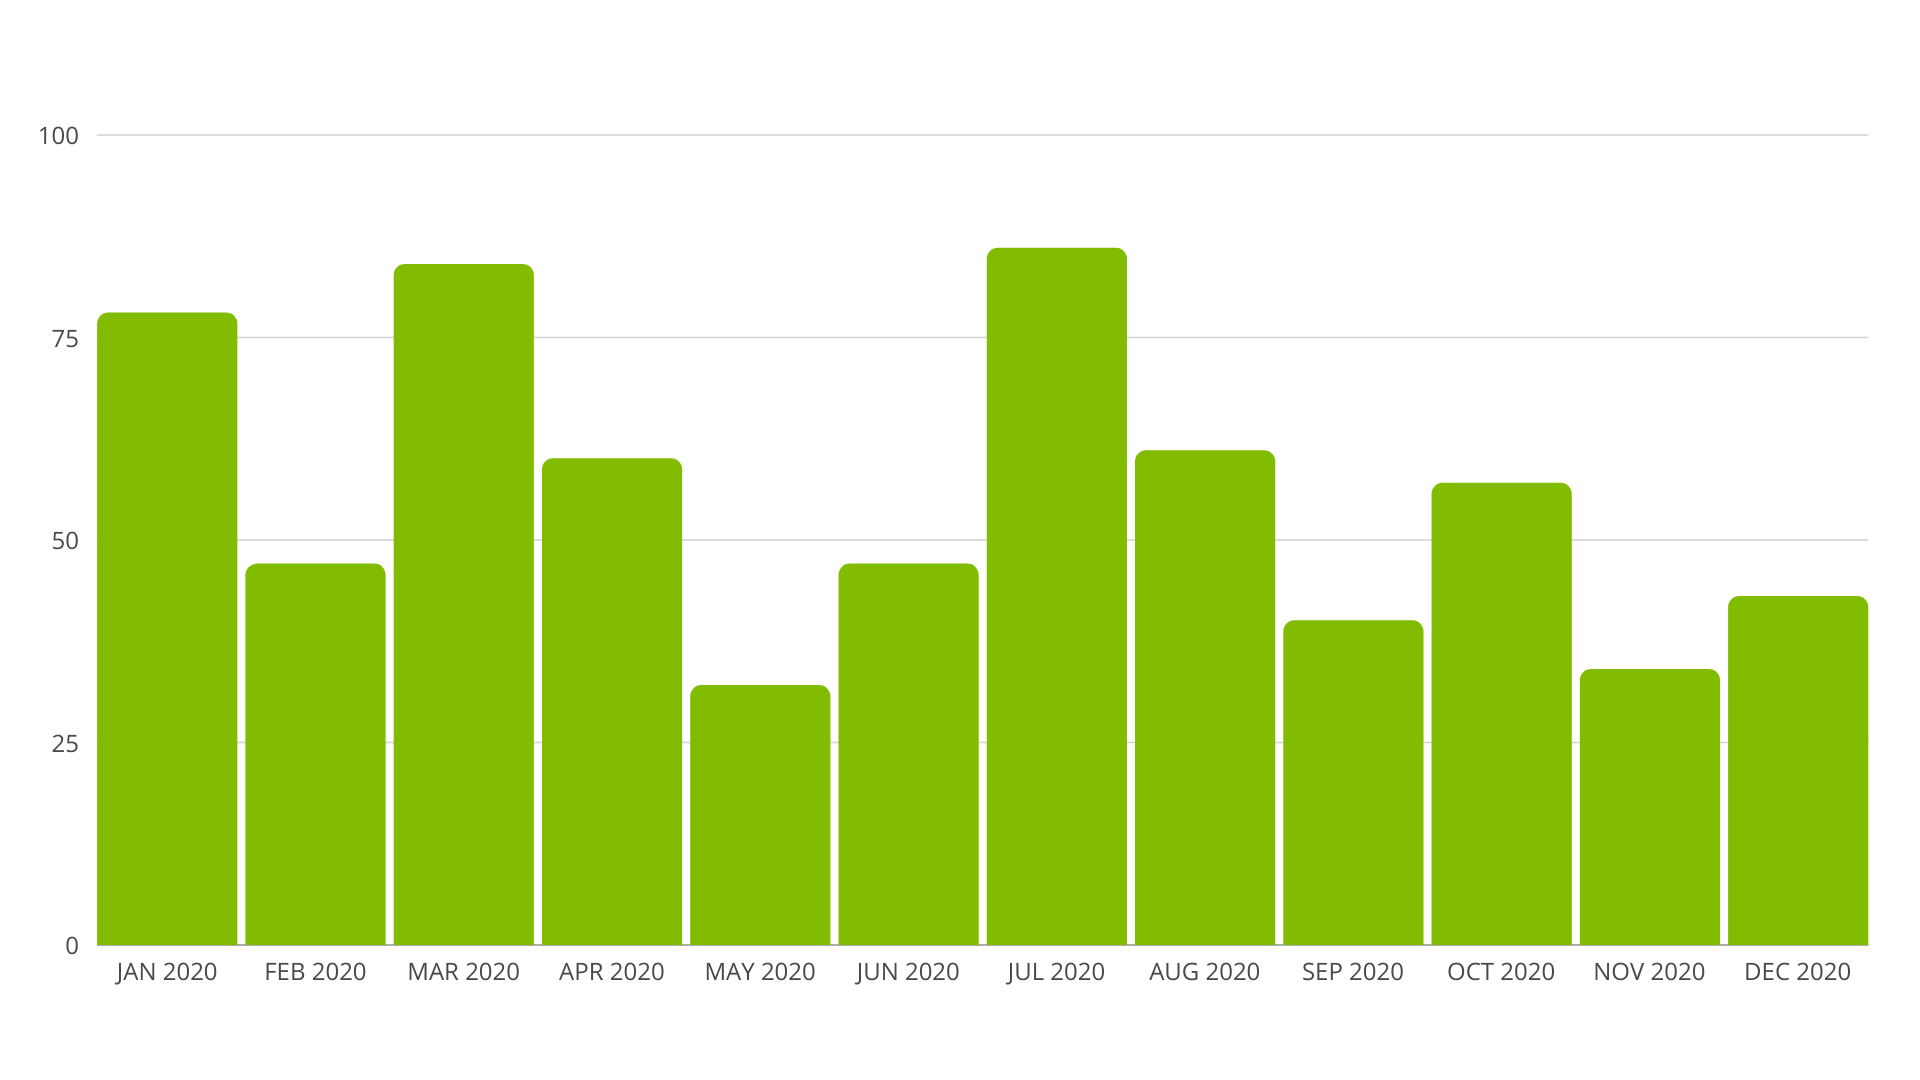
The chart on the right tracks the page views and visitors to the site each month. The rolling total for views has dropped over the past month. Although the page views are trending down, for the overall year, we are up over 3.5% when compared to the same period last year.
Website statistics for the past 12 months
(January 1, 2020 – December 31, 2020).
- Visitors: 6,774
- Page Views: 16,080
Average time on site
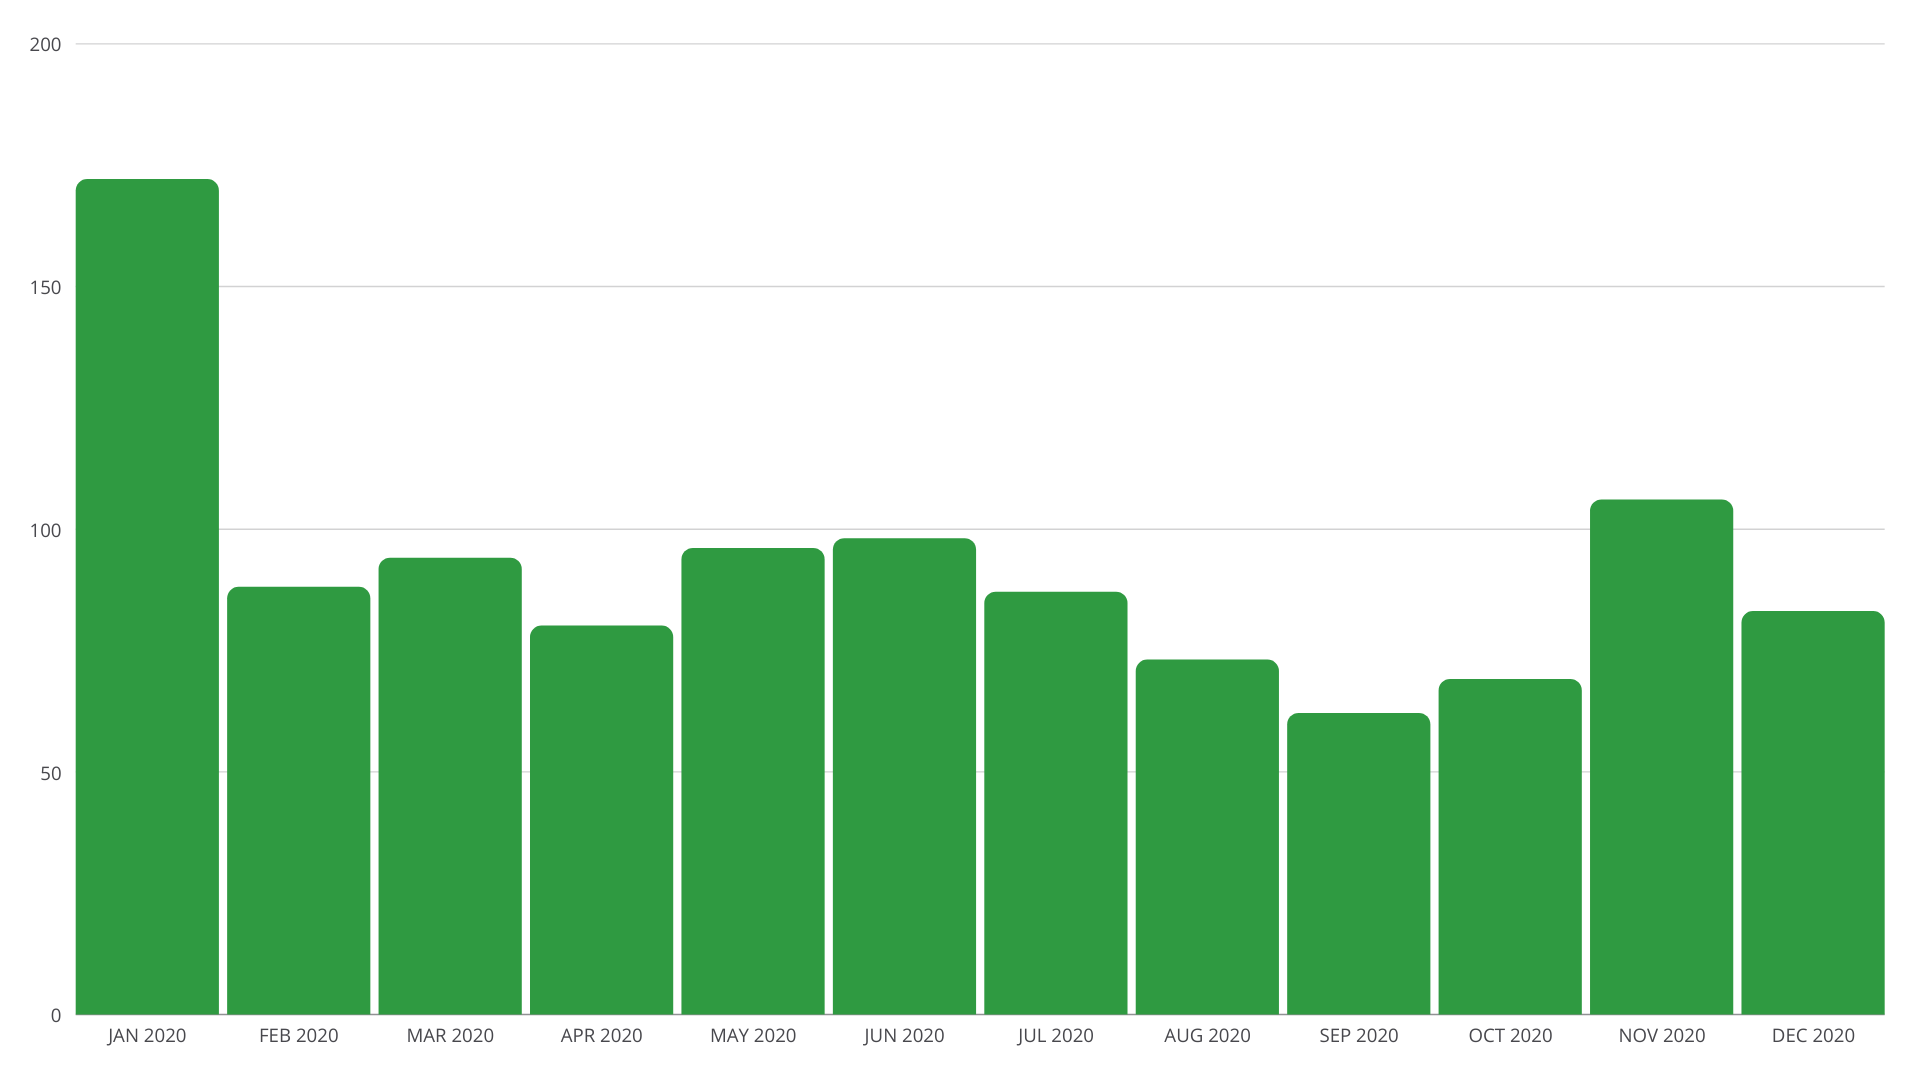
The average time visitors are spending on the website has increased slightly over the past month, to 1 minute and 34 seconds (94 seconds).
Top pages by views for the past year
(January 1, 2020 – December 31, 2020)
- Homepage – 3,857
- Why Urban Forests – 638
- About Us – 504
- Resources – 425
- Haiku 2020 – 394
- Homepage (version) – 387
- Board –382
- Trees are Essential – 341
- California Climate Trees Map – 318
- Events – 314
Top pages by views for the past month
(December 1, 2020 – December 31, 2020)
- Homepage – 282
- Why Urban Forests – 69
- Board –41
- About Us –40
- California Climate Trees Map – 36
- Programs – 21
- Trees are Essential – 21
- Contact Us – 20
- Bay Area Urban Forest Ecosystem Council – 19
- Board Resources – 19
Website performance over the past year (January 1, 2020 – December 31, 2020)
Website
Sessions:
8,523
Visitors
to Site:
6,774
Page
Views:
16,080
% New Sessions:
79%
Pages/
Session:
1.89
Avg. Time
on Site:
1m 34secs
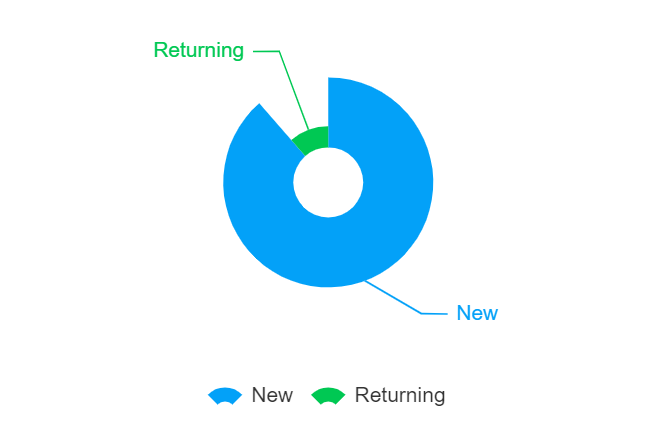
New Sessions:
90%
Returning Sessions:
10%
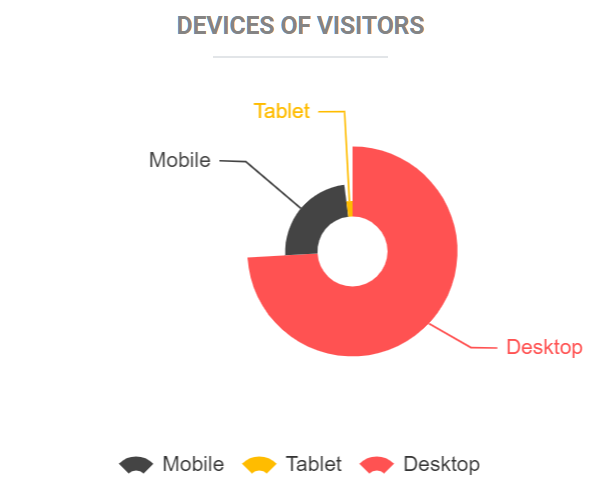
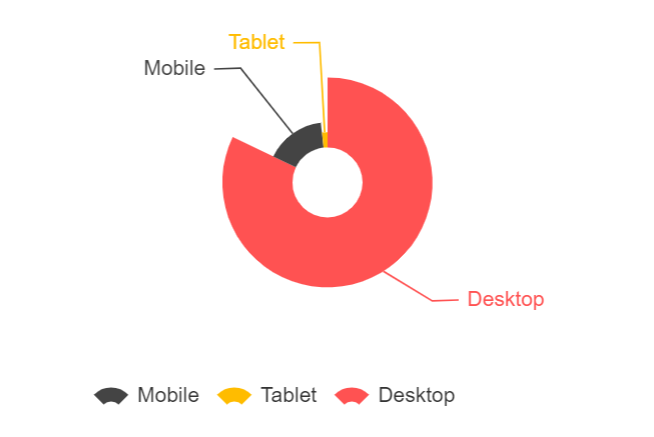
Device:
Tablet 2%
Mobile 20%
Desktop 78%
Classy
Donations this year:
Donations:
$14,436
Donations: 42
Trees are Essential Campaign
We are developing more content for the Trees are Essential campaign. The focus at the moment is infographics from a study that shows a correlation between canopy coverage and lower health care costs. We will share them here when they are ready.
IFGU Communications Channels
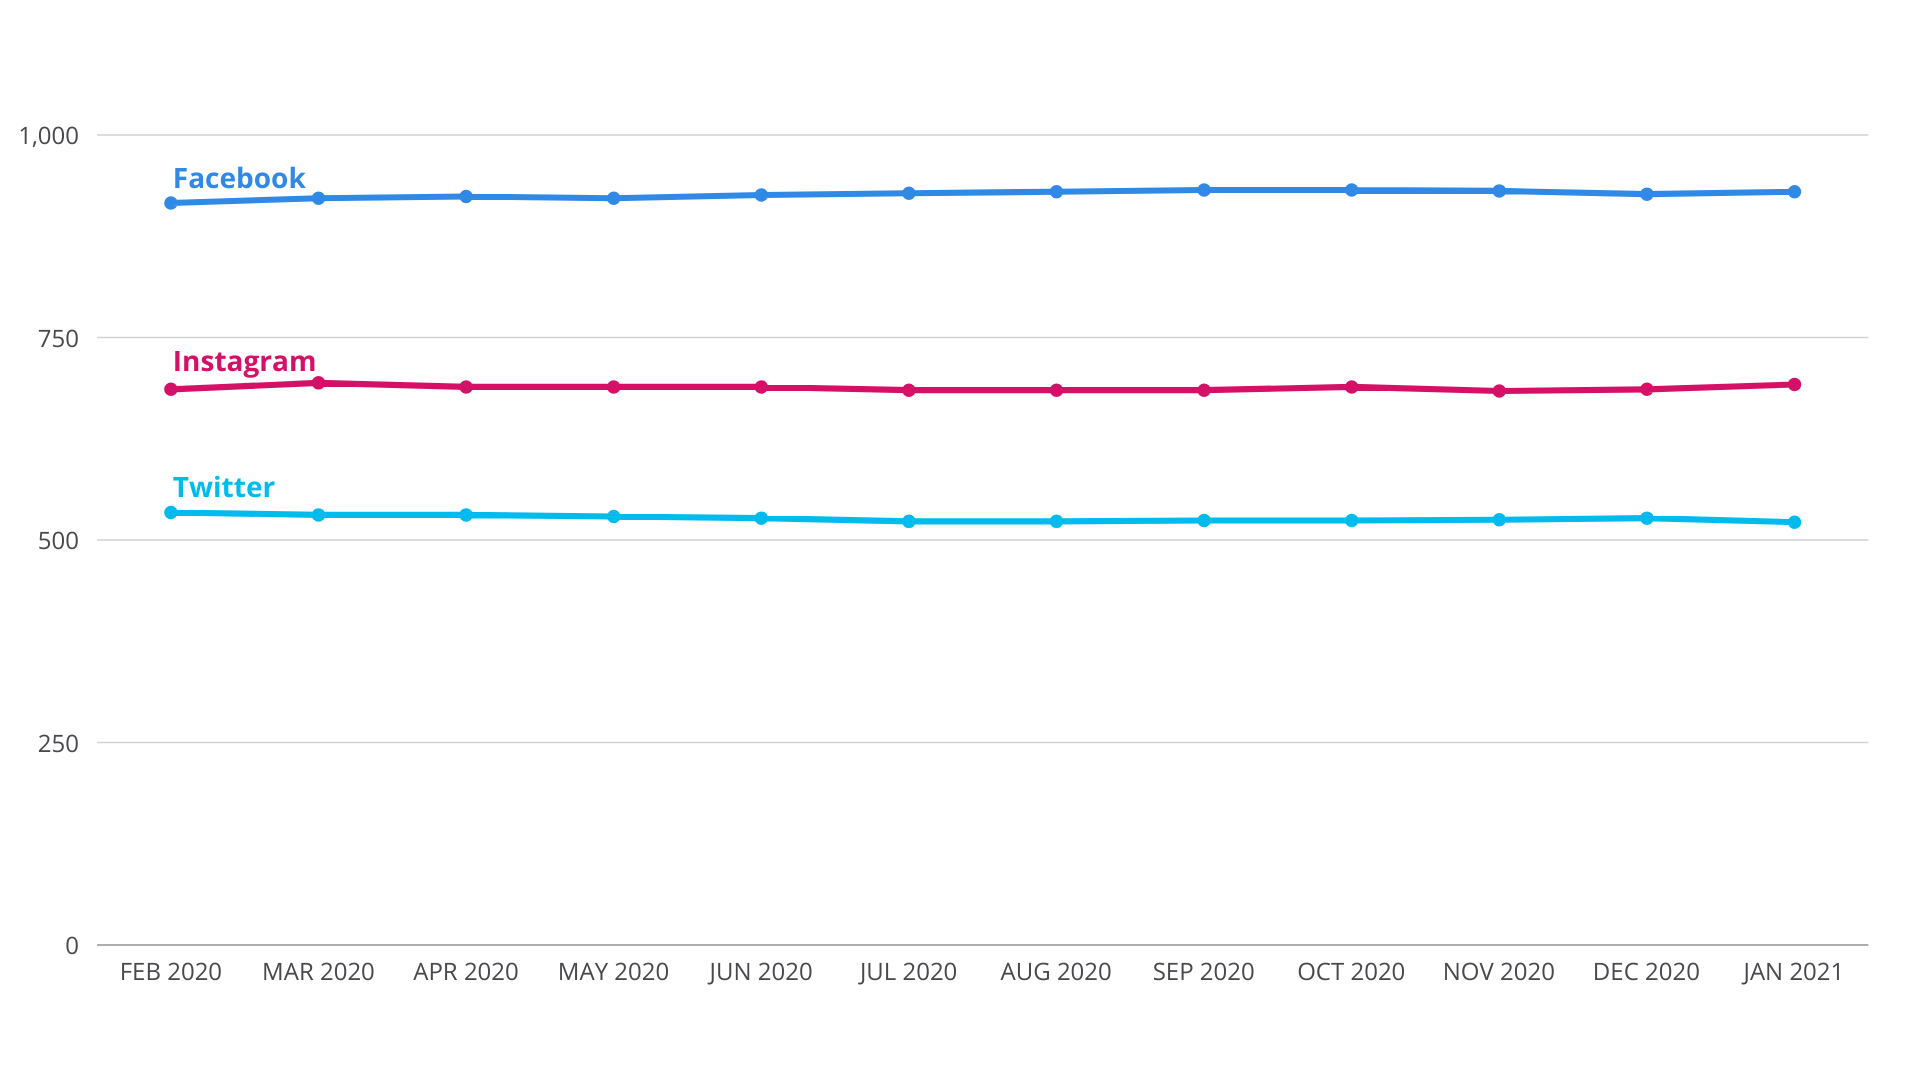
Facebook followers: 930
Twitter: 522
Instagram: 692
IFGU Website Views and Visits
Highlights
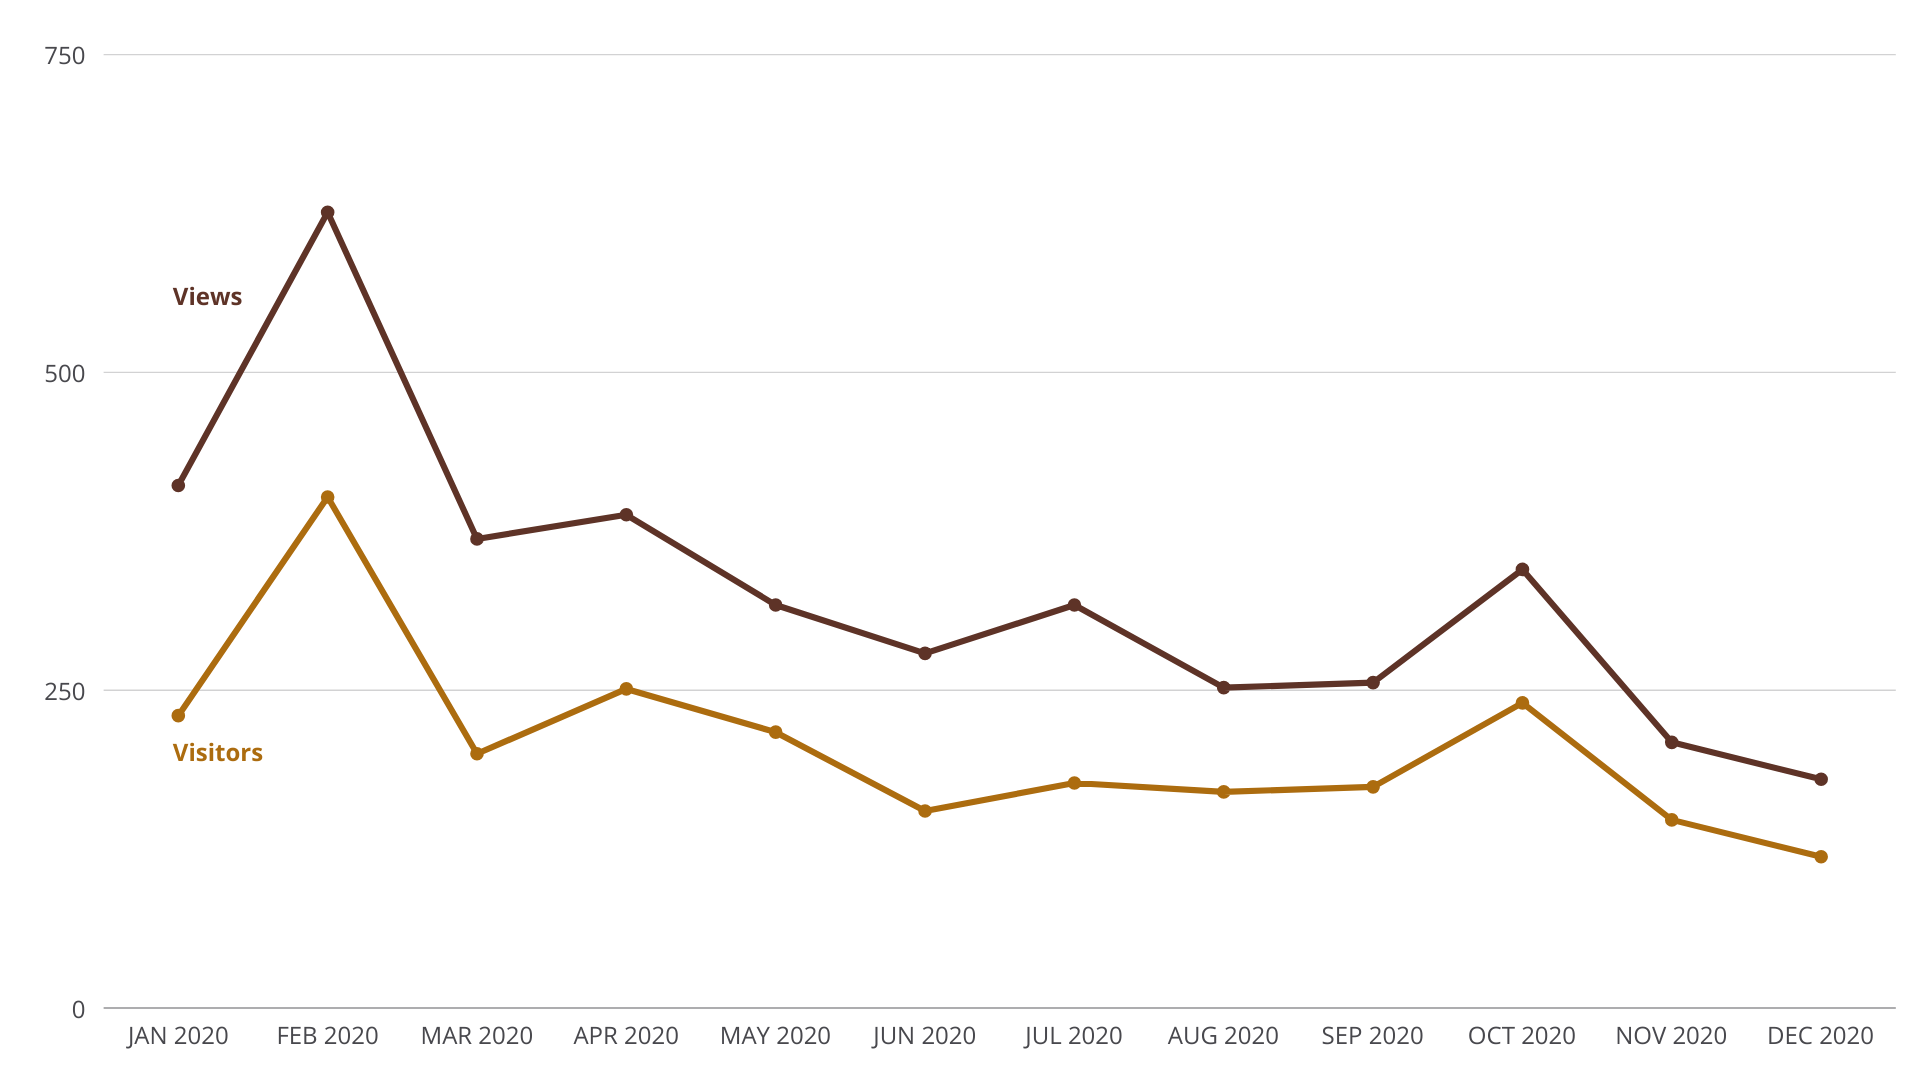
Visits peaked with tree planting events.
Page Views (November): 180
Visitors (November): 119
Visits to the IFGU site are often from new visitors and over 25% are coming from mobile devices and tablets. Therefore, I am planning to make the design of the site to be more ‘mobile-first’.
Average time on site
The average time visitors are spending on the website is 43 seconds for last month and 54 seconds for 2020.
Top pages by views (January 1, 2020– December 31, 2020)
- Invest From the Ground Up –
Growing Trees Make Great Neighborhoods – 1,331 - Tree care guide and tips – 237
- Resources – 231
- Trees are the lungs of the earth – 175
- San Francisco Bay Area Tree Planting Project – 171
- 10 Myths about Trees – 164
- Great things grow on trees – 155
- Trees Mean Business – 113
- About – 100
- Why topping hurts trees – 75
Top pages by views (December 1, 2020 – December 31, 2020)
- Invest From the Ground Up –
Growing Trees Make Great Neighborhoods – 46 - 10 myths about trees – 16
- Trees mean business – 16
- Resources – 13
- Why topping hurts trees – 13
- Tree care guide and tips – 9
- Great Things Grow on Trees – 8
- Tree are the lungs of the earth – 7
- About – 6
- San Francisco Bay Area Tree Planting Project – 6
Website performance over the past year (January 1, 2020 – December 31, 2020)
Website
Sessions:
2,794
Visitors
to Site:
2,426
Page
Views:
3,949
% New Sessions:
86%
Pages/
Session:
1.41
Avg. Time
on Site:
54 secs
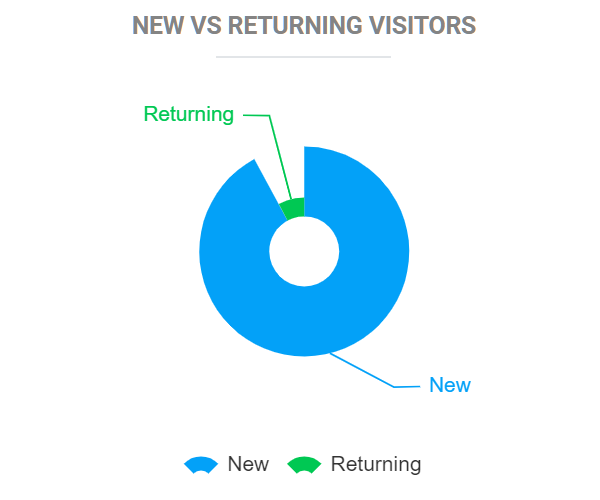
New Sessions:
92%
Returning Sessions:
8%
Device:
Tablet 2%
Mobile 22%
Desktop 76%
