November 2020
CIRCLE4.0 program logo concepts. These are the three designs the team has voted on. The second design, with the heavy line, is leading the way, with the addition of the singing bird. The feedback for the final design (far right) included increasing the size of the heads and creating a simplified version.

CAUFC Communications Channels
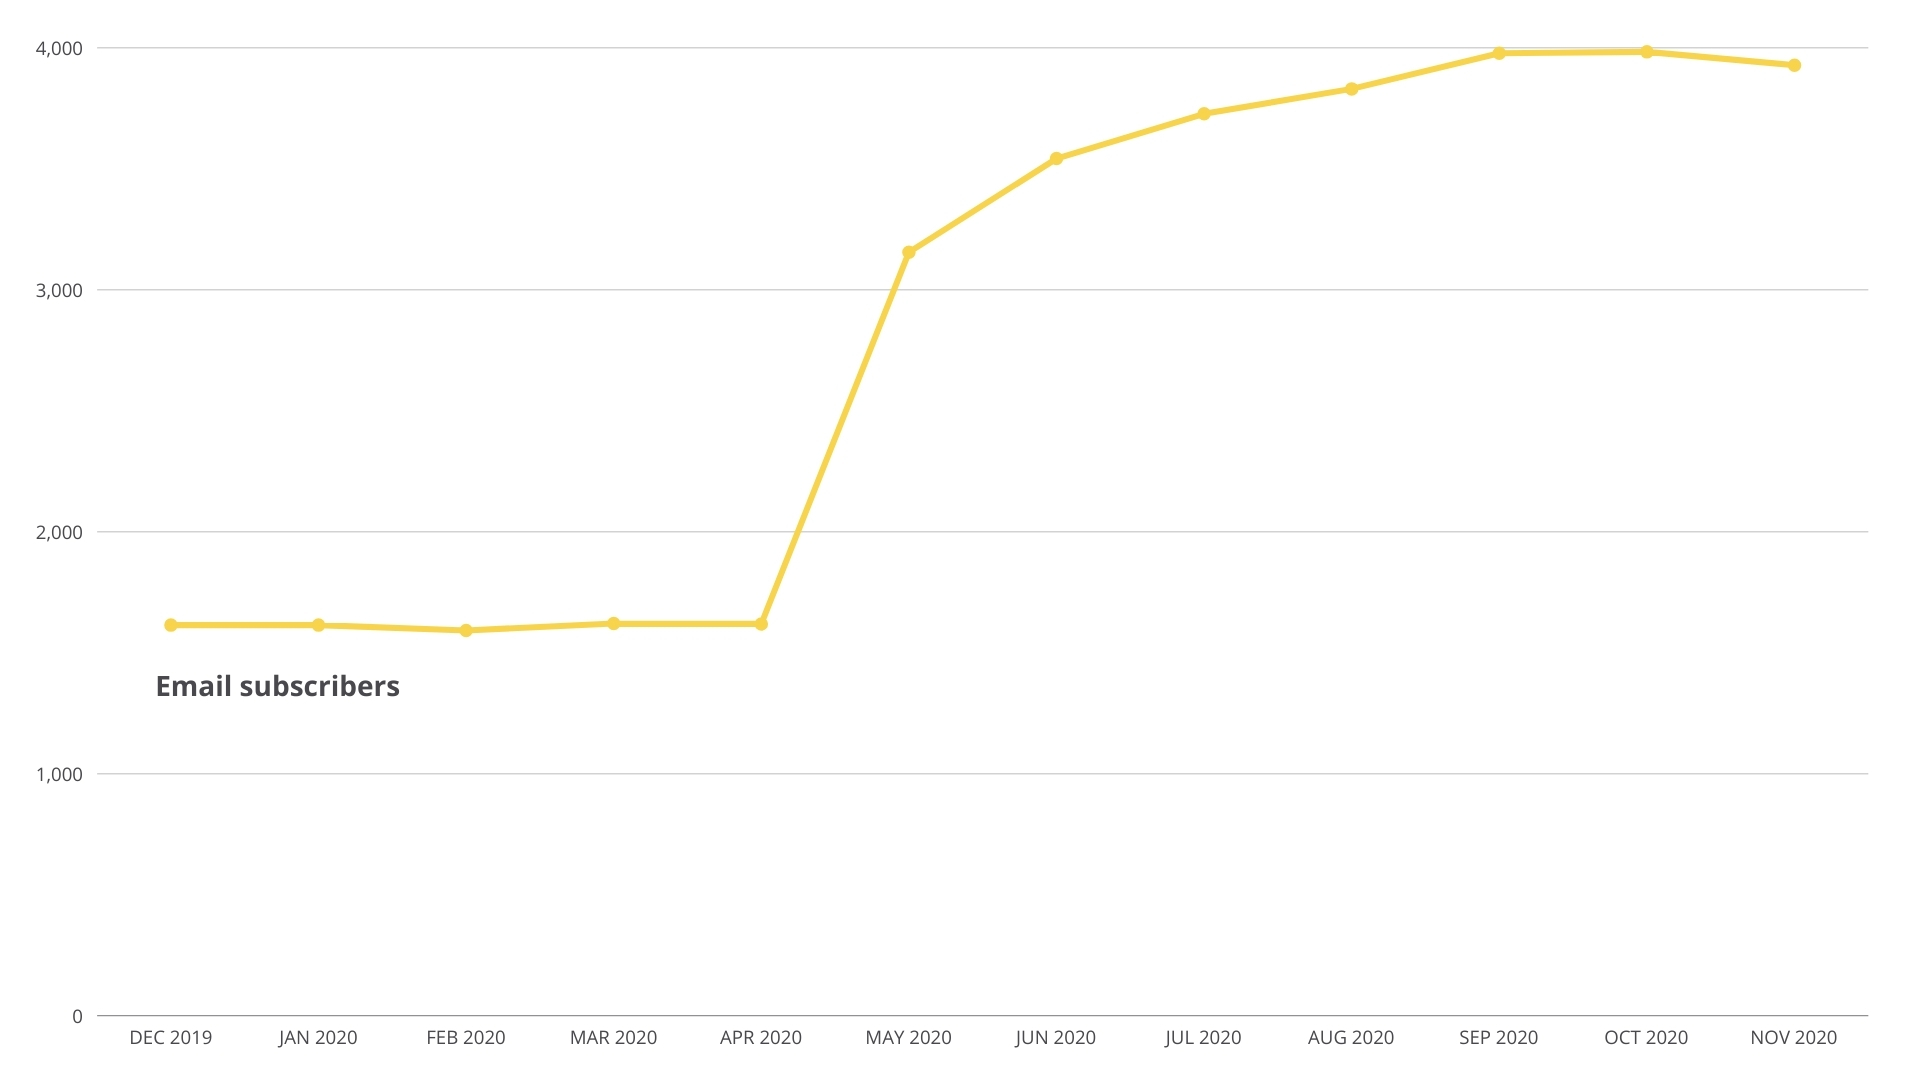
Email subscribers: 3,928
The email subscribers have slightly decreased over the past month, with a number of addresses being cleaned with the latest email newsletter.
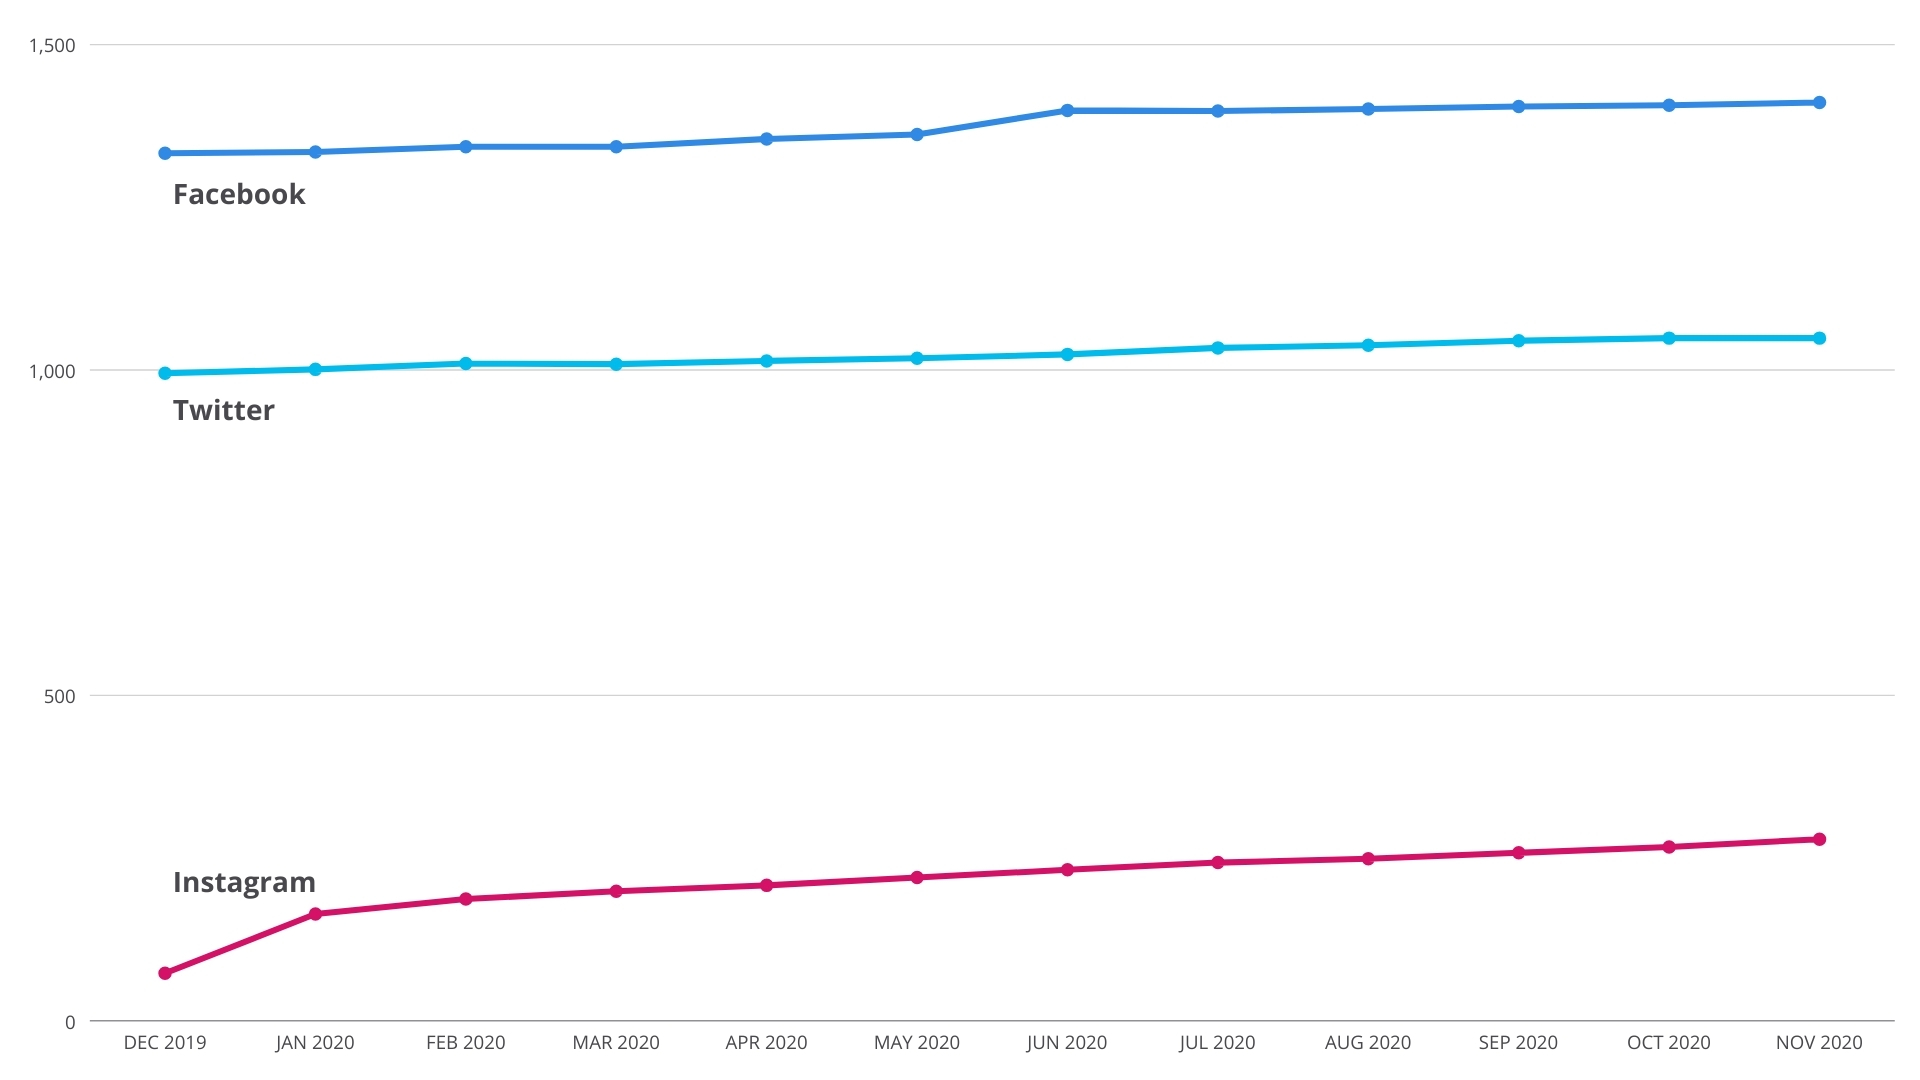
Facebook page followers: 1,411
Twitter: 1,049
Instagram: 279
All social media channels are continuing to grow slowly.
Newsletter Performance & Email Audience
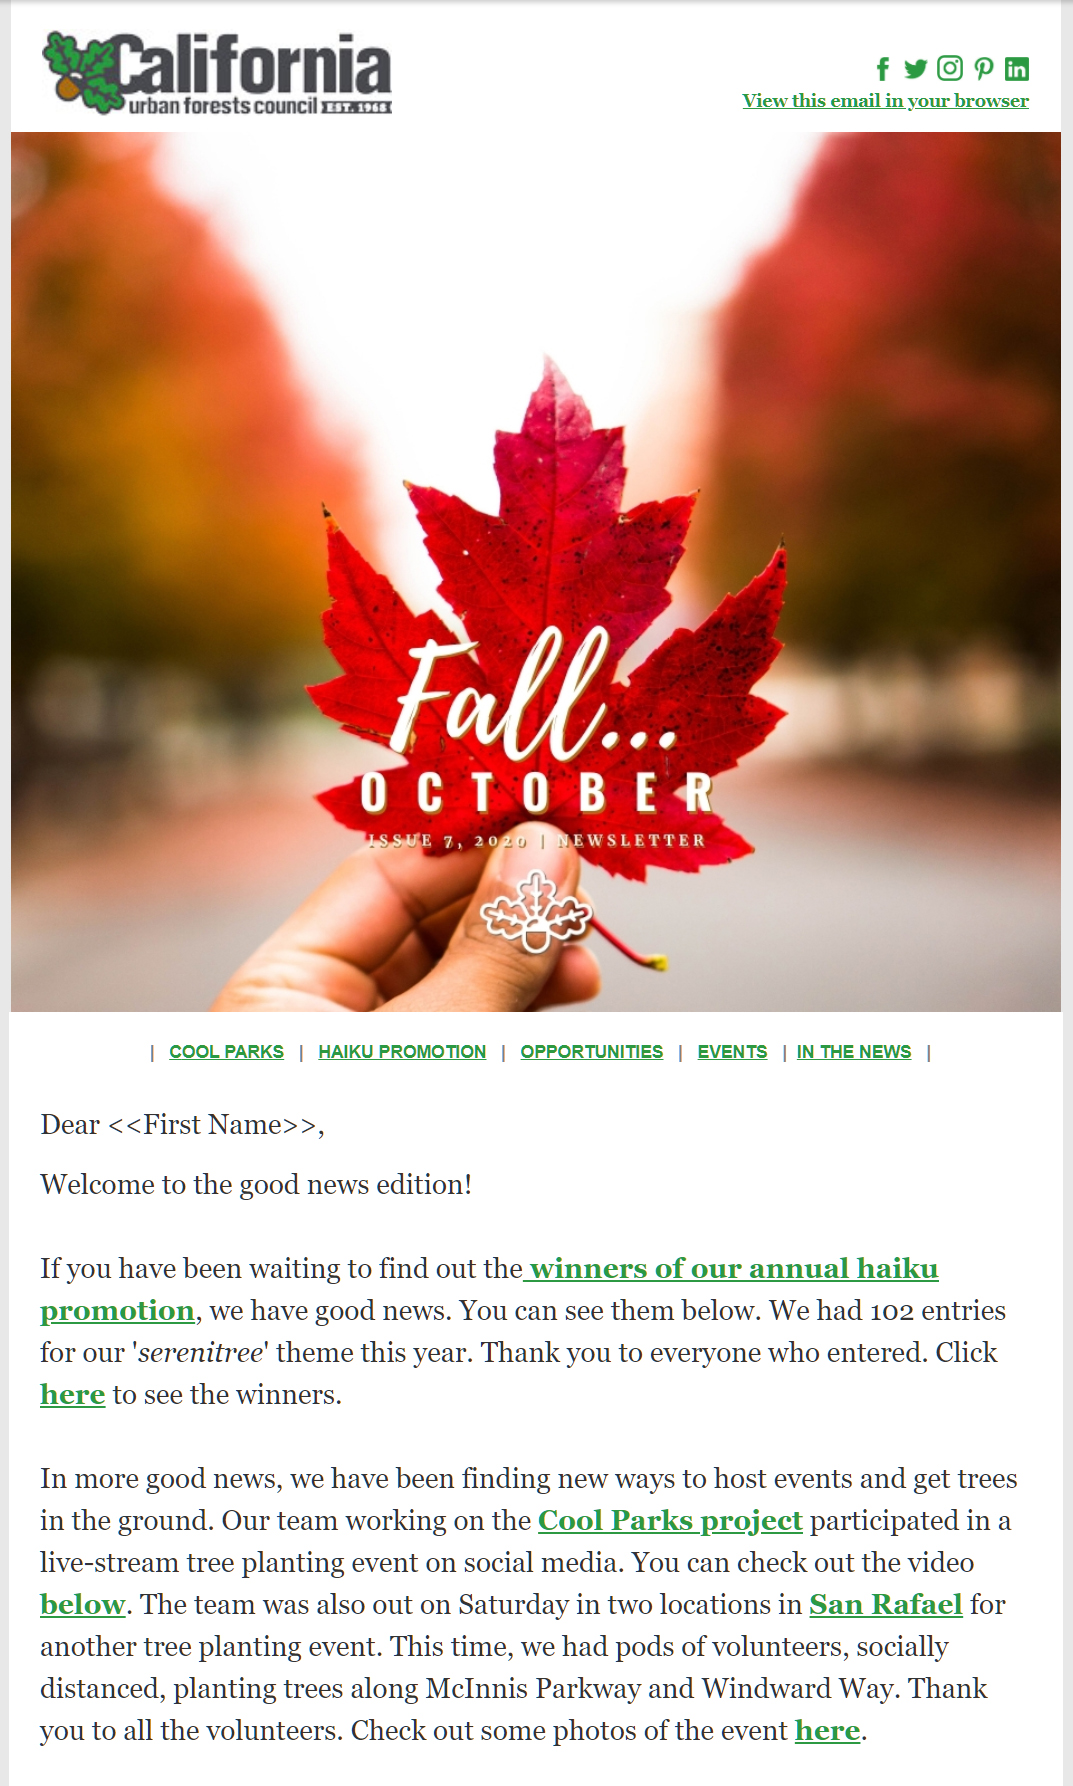
The October newsletter went out on the 19th and can be seen here.
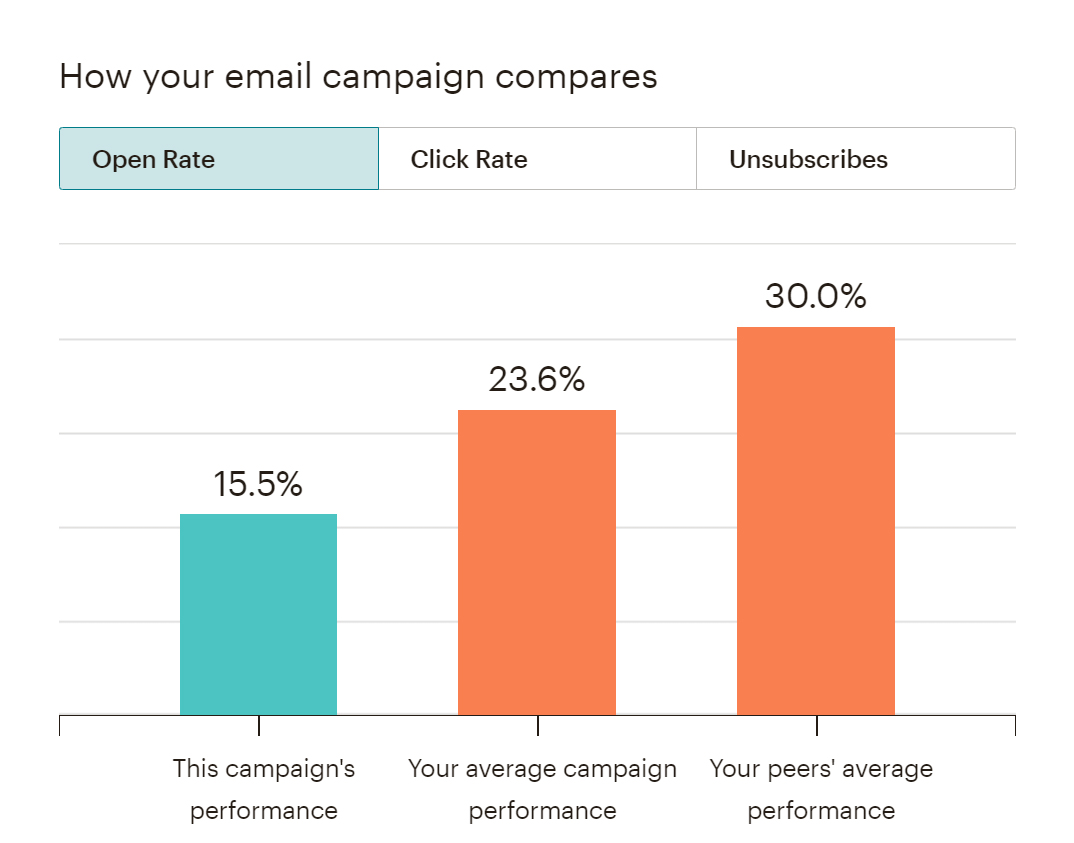
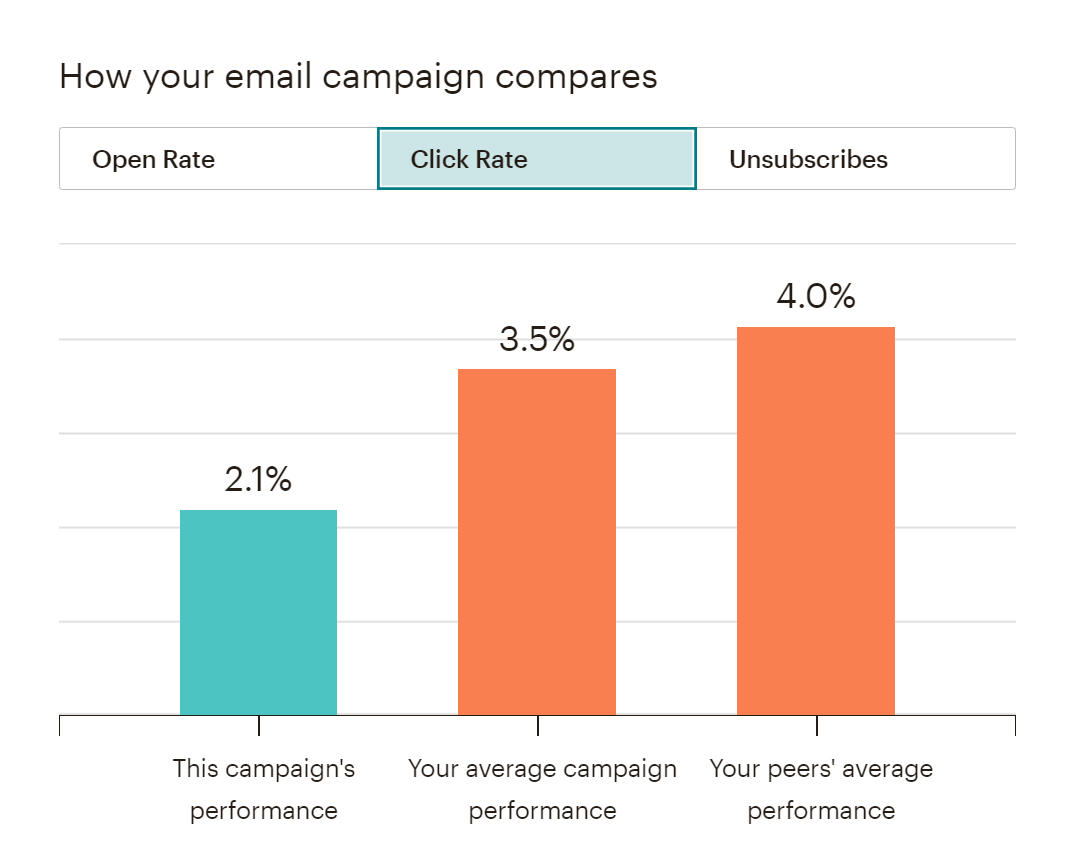
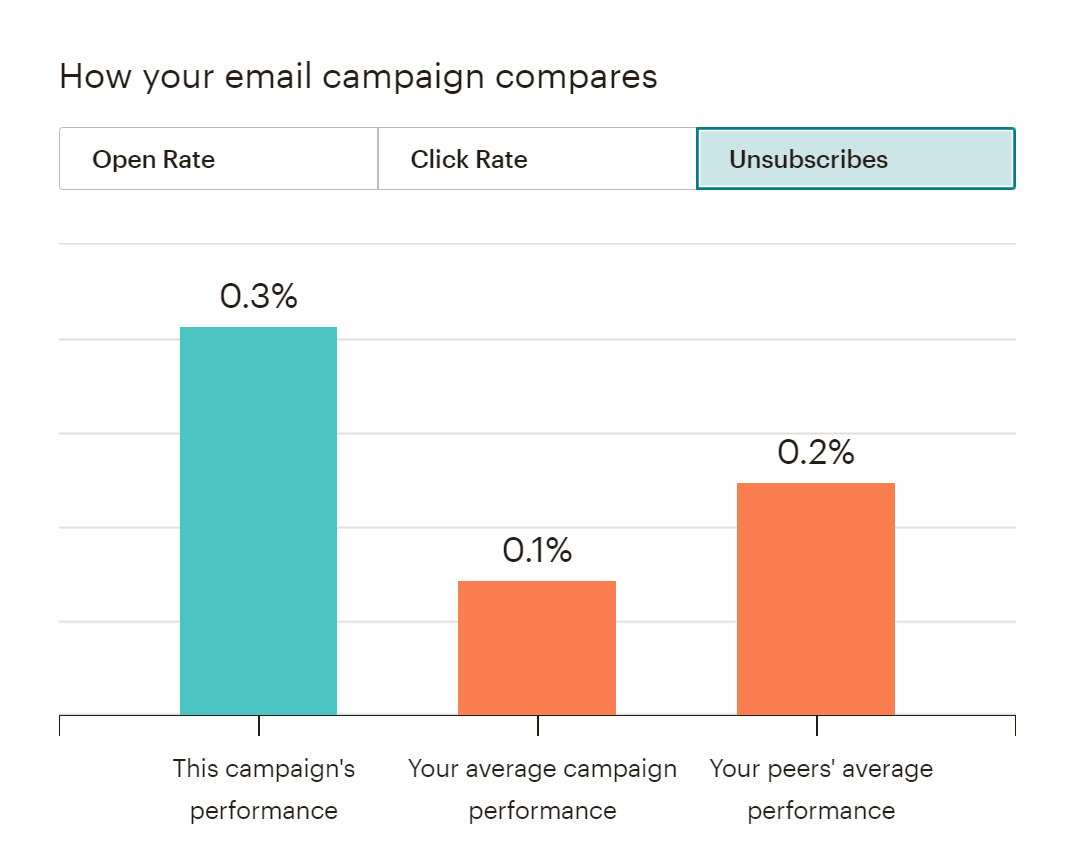
The results for the campaign (newsletter) can be seen on the right. Our open rate is down, as was the click rate for this newsletter. The unsubscribe rate was higher for this email but this was sent to our entire audience, including our list of public works and water department(s), and looking through the cleaned or unsubscribed lists, it was mostly from those areas.
The audience for our newsletters tends to be aged 45+. I will be looking at using groups and segments of our total audience to increase the performance of our newsletters in the future. The November newsletter will include a short survey so that we can tailor content to the interests of our audience more.
CAUFC Website Views and Visits
Highlights
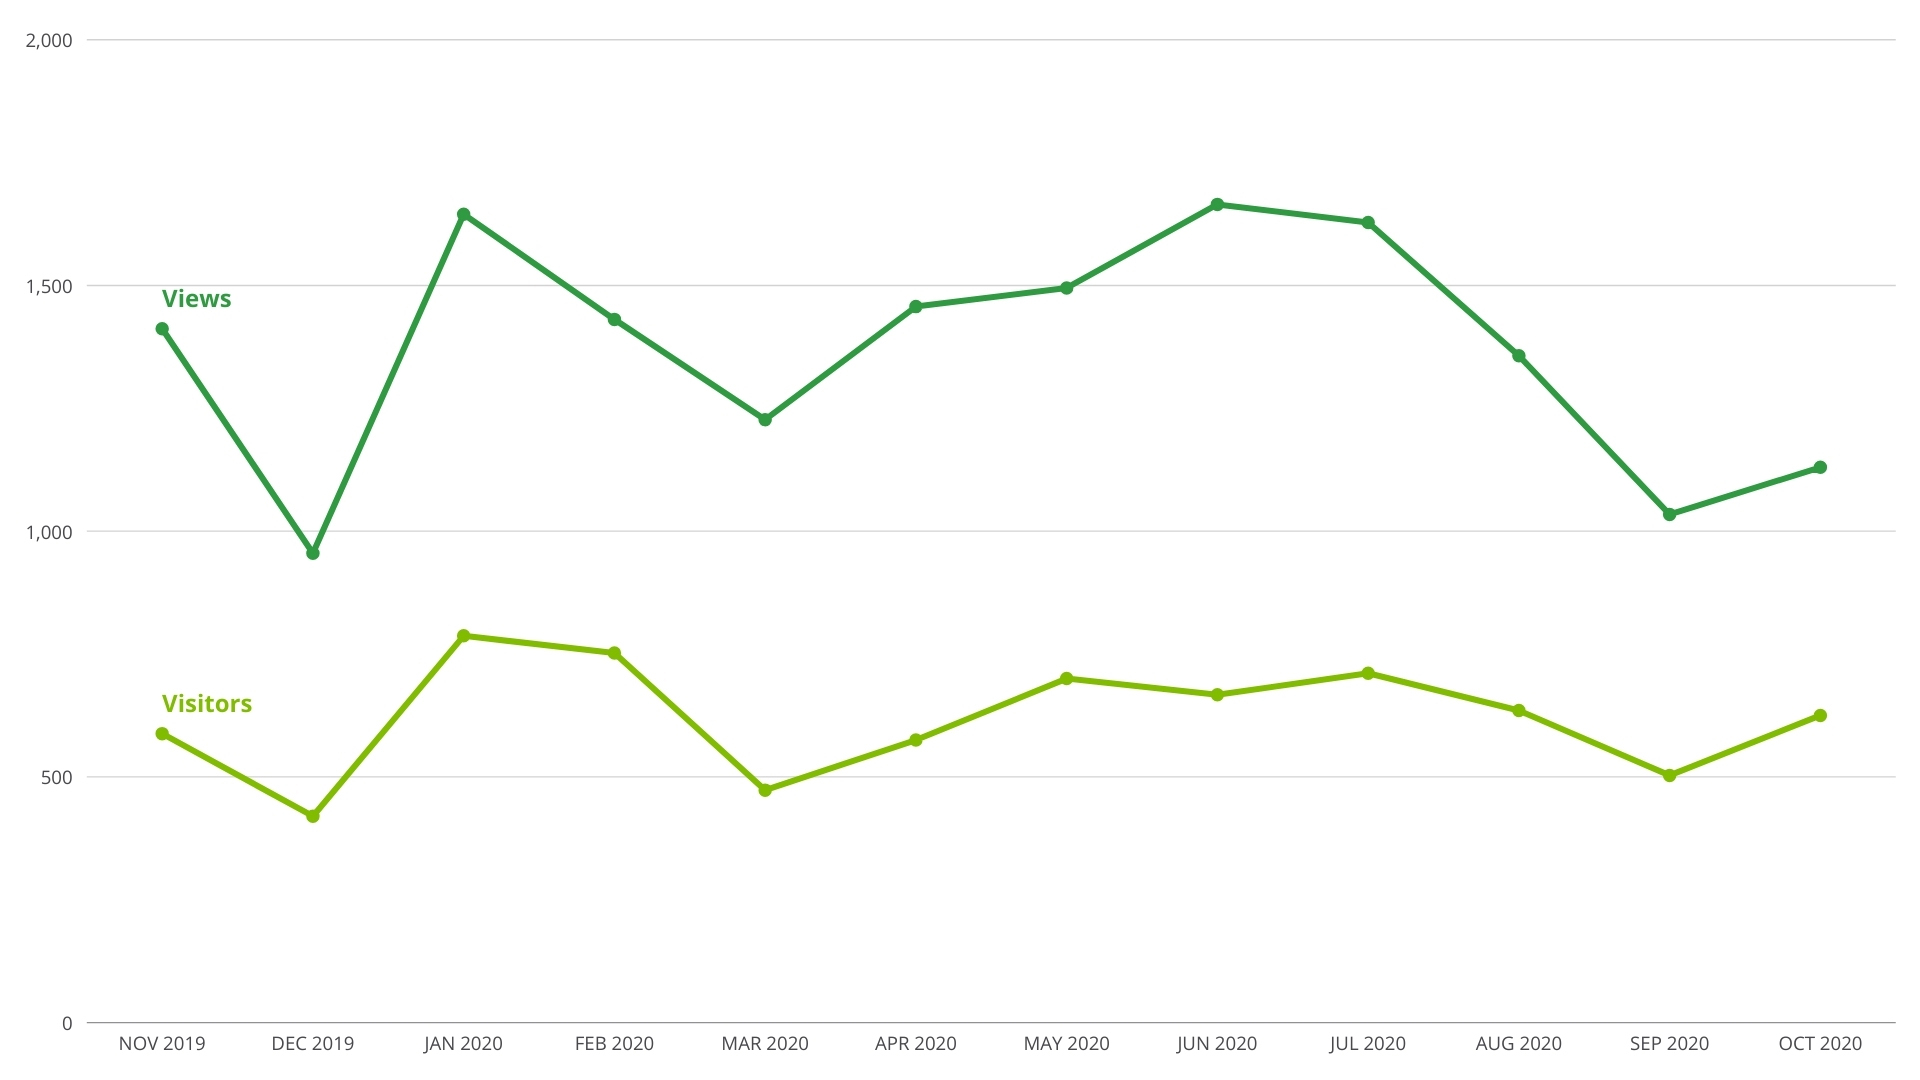
The chart on the right tracks the page views and visitors to the site each month. The rolling total for views has dropped over the past month. Although the page views are slightly down, for the overall year, we are up almost 25% when compared to November 1, 2018, to October 31, 2019.
Website statistics for the past 12 months
(November 1, 2019 – October 31, 2020).
- Visitors: 6,923
- Page Views: 16,440
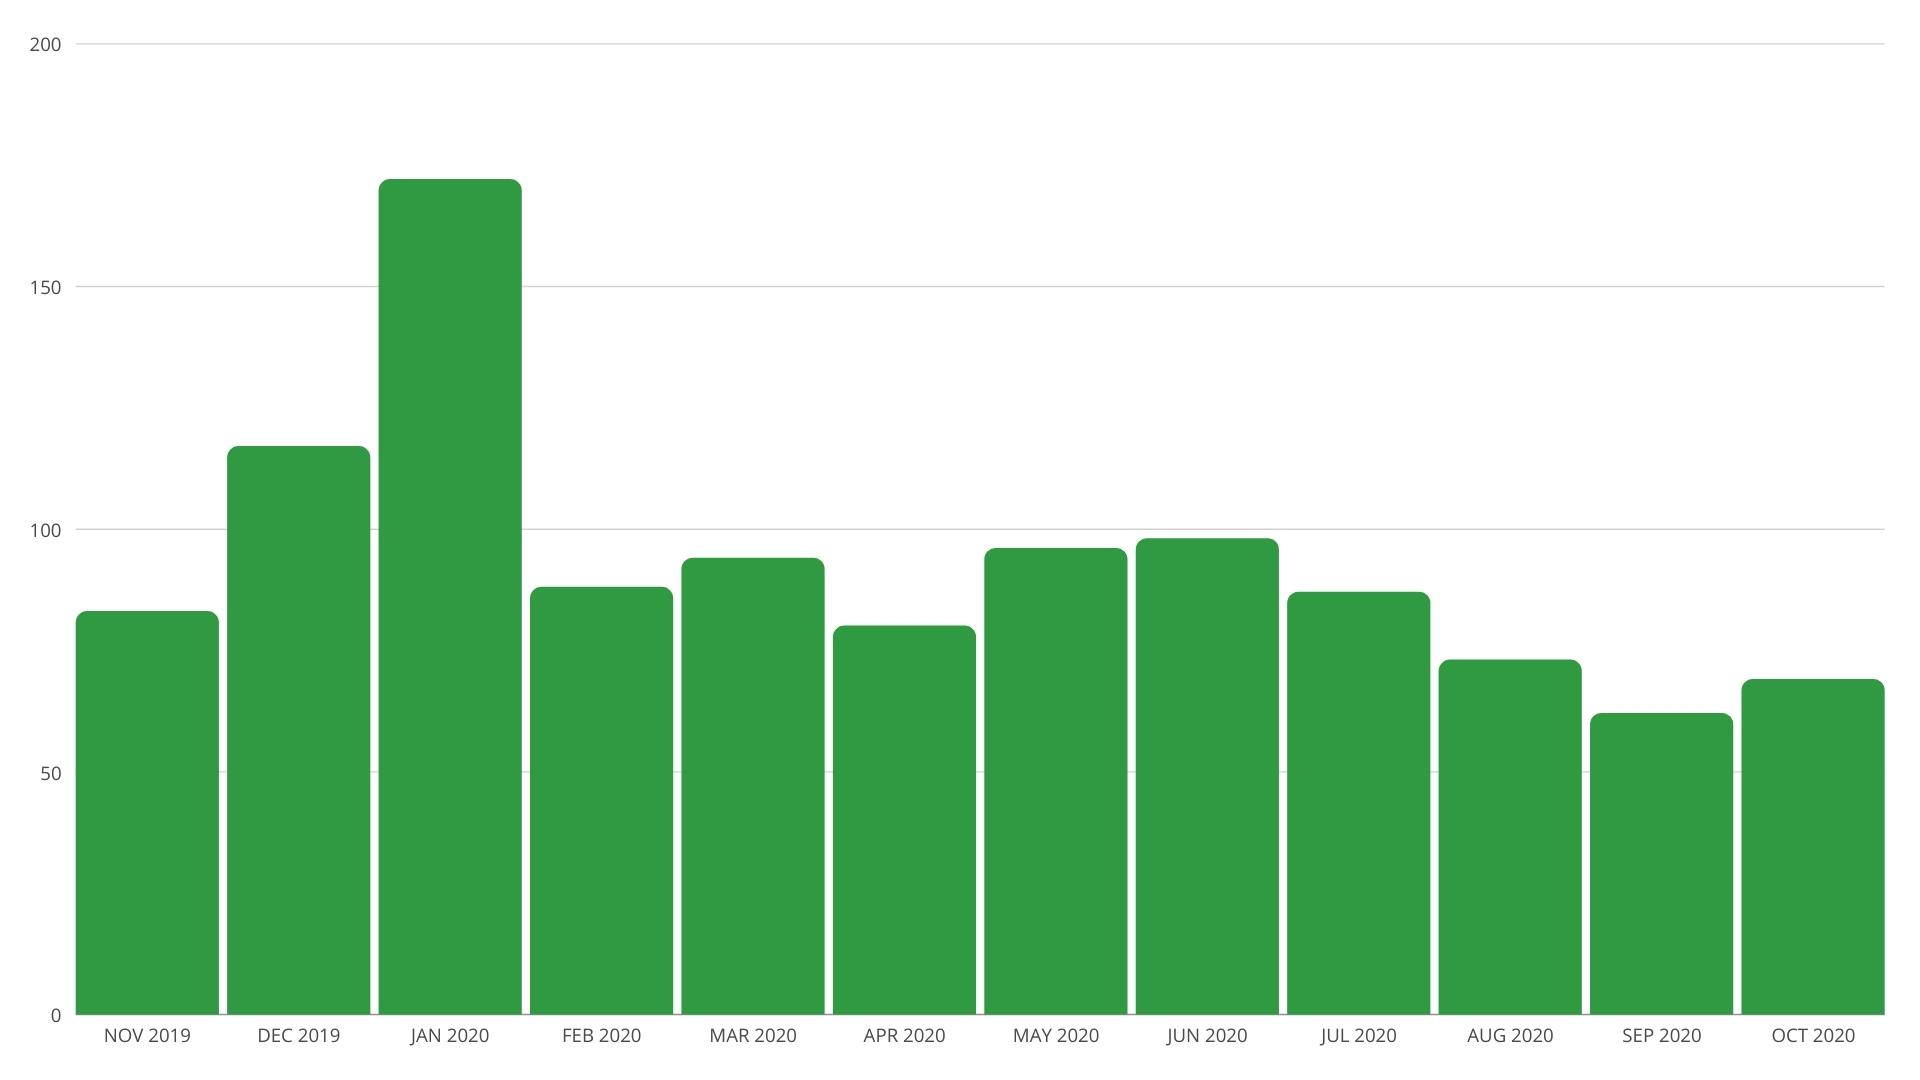
Average time on site
The average time visitors are spending on the website has increased slightly over the past month, to 1 minute and 9 seconds (65 seconds).
Website performance over the past year (November 1, 2019 – October 31, 2020)
Website
Sessions:
8,619
Visitors
to Site:
6,923
Page
Views:
16,440
% New Sessions:
79%
Pages/
Session:
1.91
Avg. Time
on Site:
1m 35secs
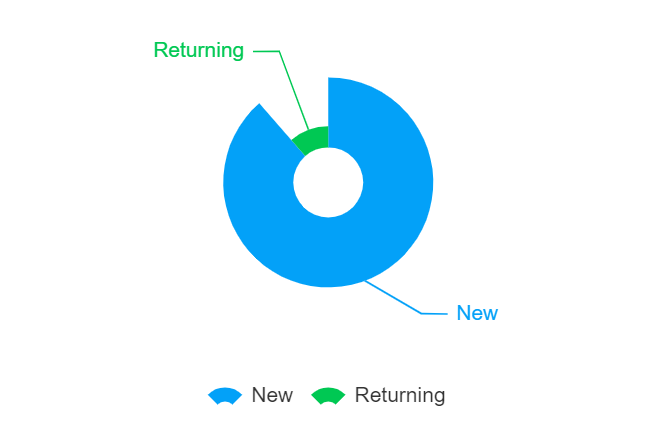
New Sessions:
90%
Returning Sessions:
10%
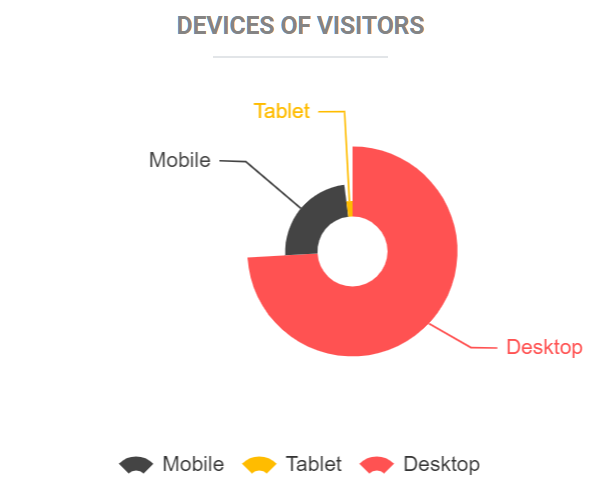
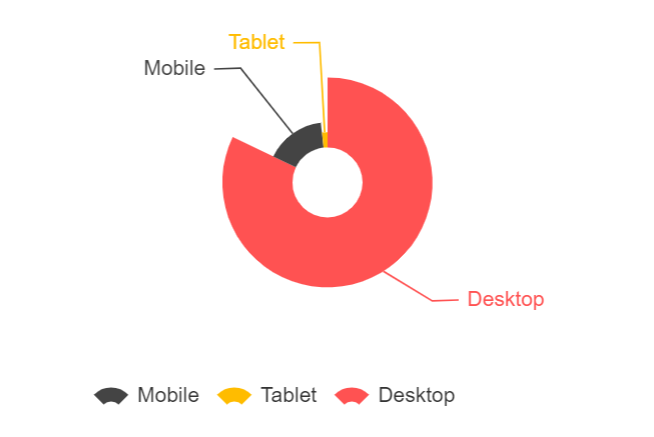
Device:
Tablet 2%
Mobile 20%
Desktop 78%
Trees are Essential Campaign
Classy
Donations this year:
Donations: $10,625
Donations: 28
We are developing more content for the Trees are Essential campaign. The focus at the moment is infographics from a study that shows a correlation between canopy coverage and lower health care costs. We will share them here when they are ready.
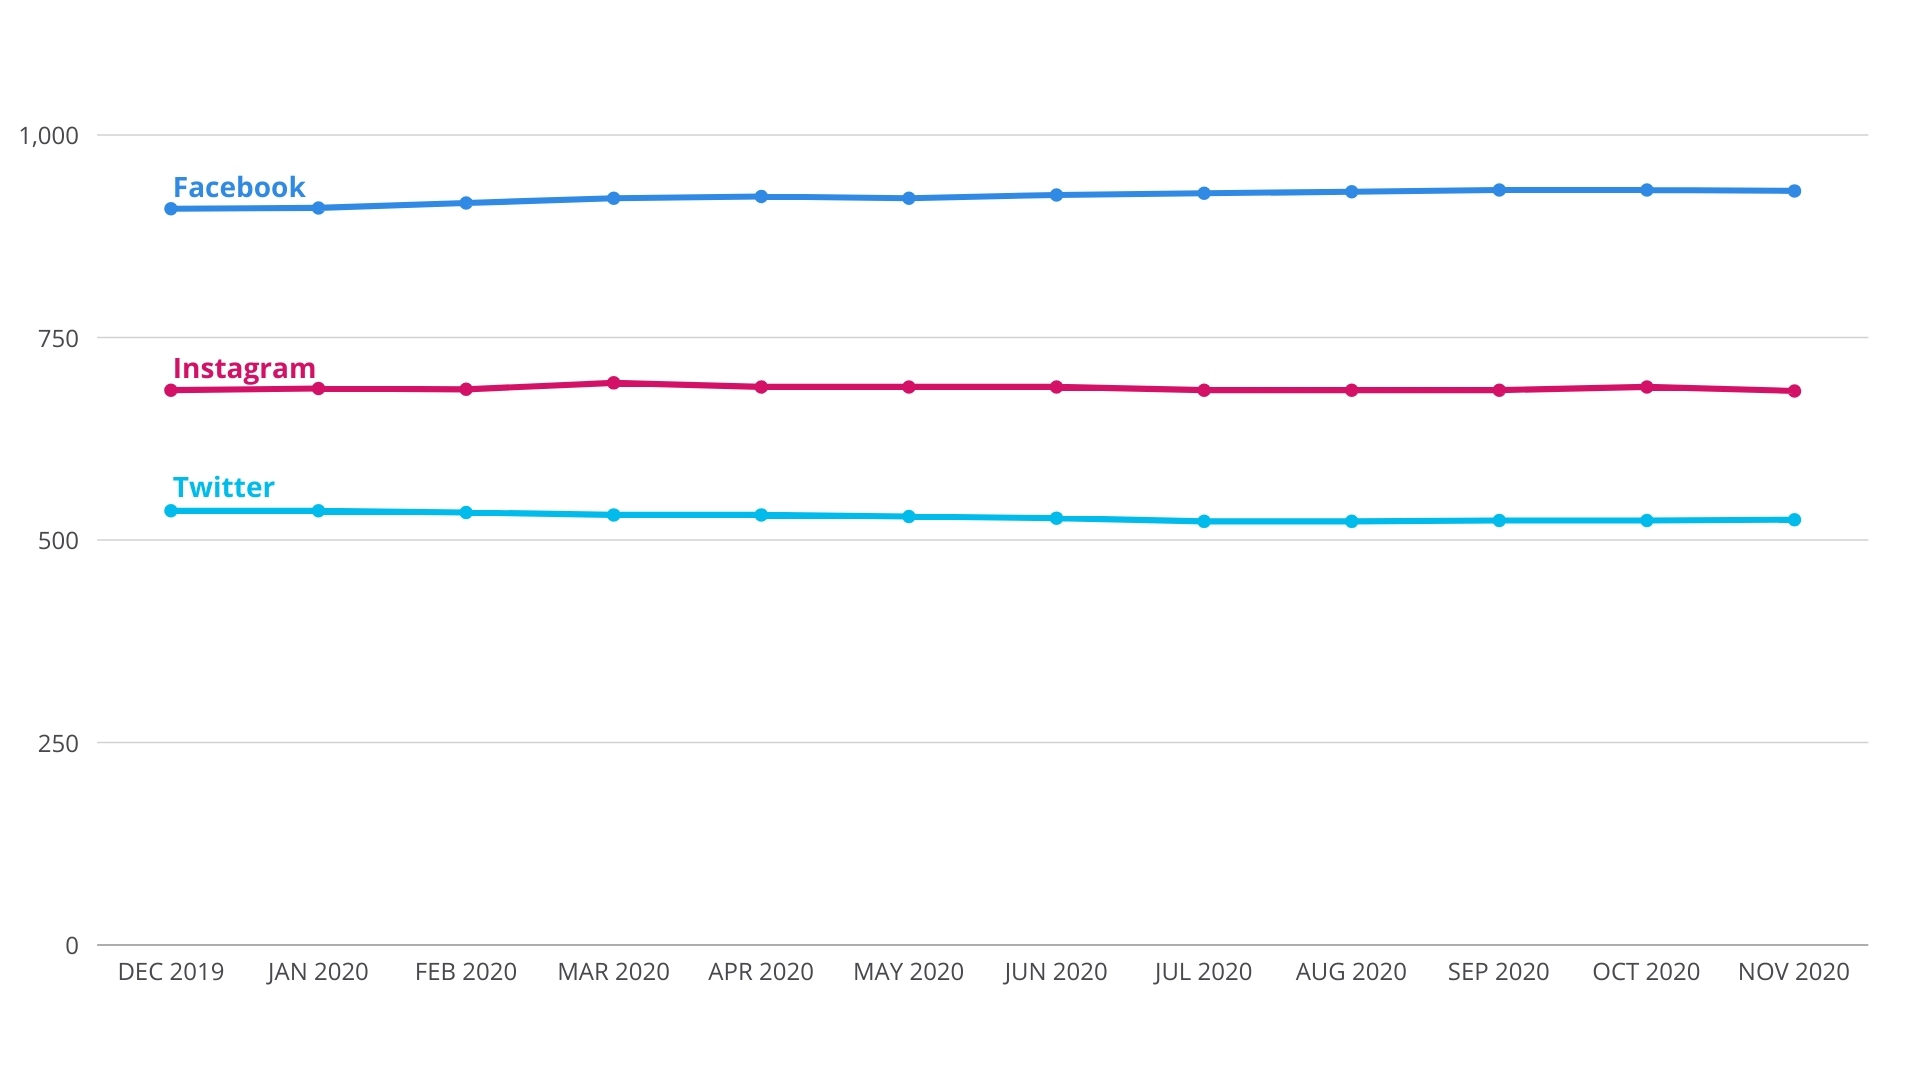
IFGU Communications Channels
Facebook followers: 931
Twitter: 525
Instagram: 684
IFGU Website Views and Visits
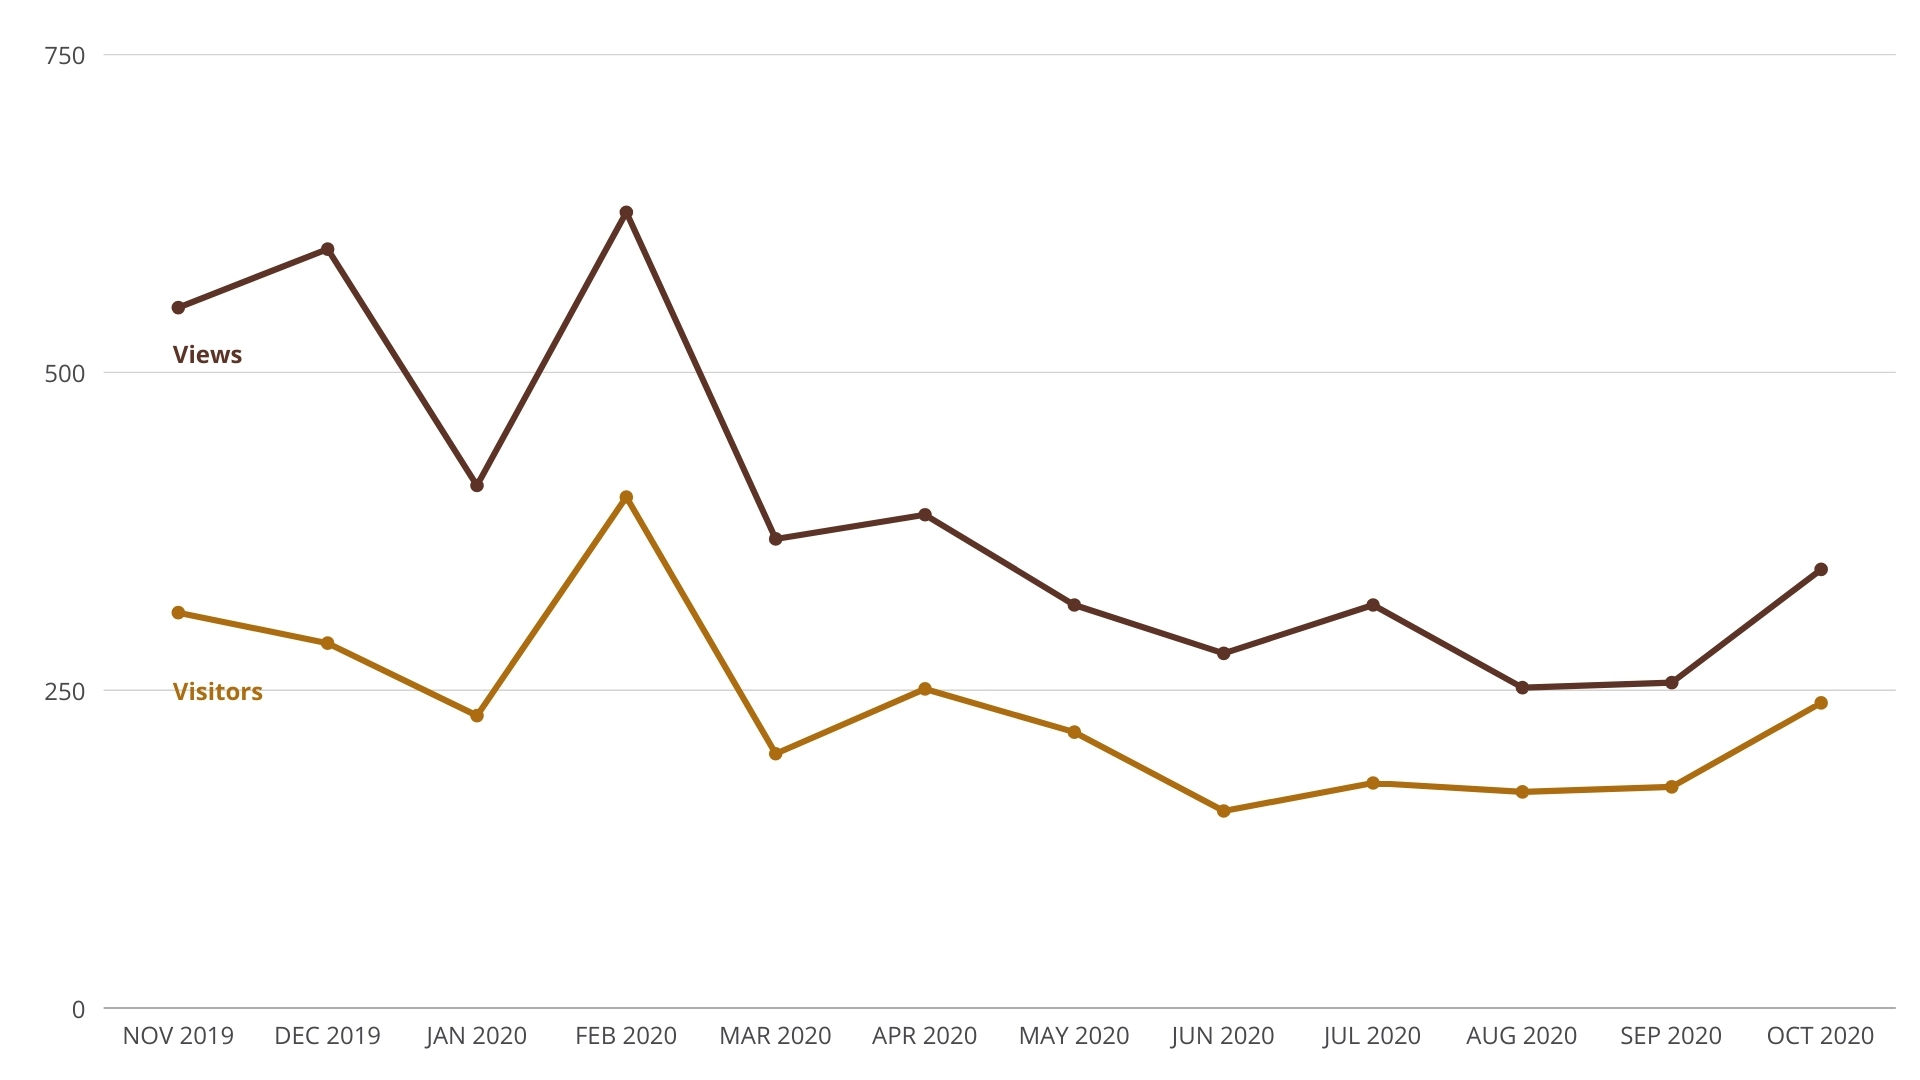
Highlights
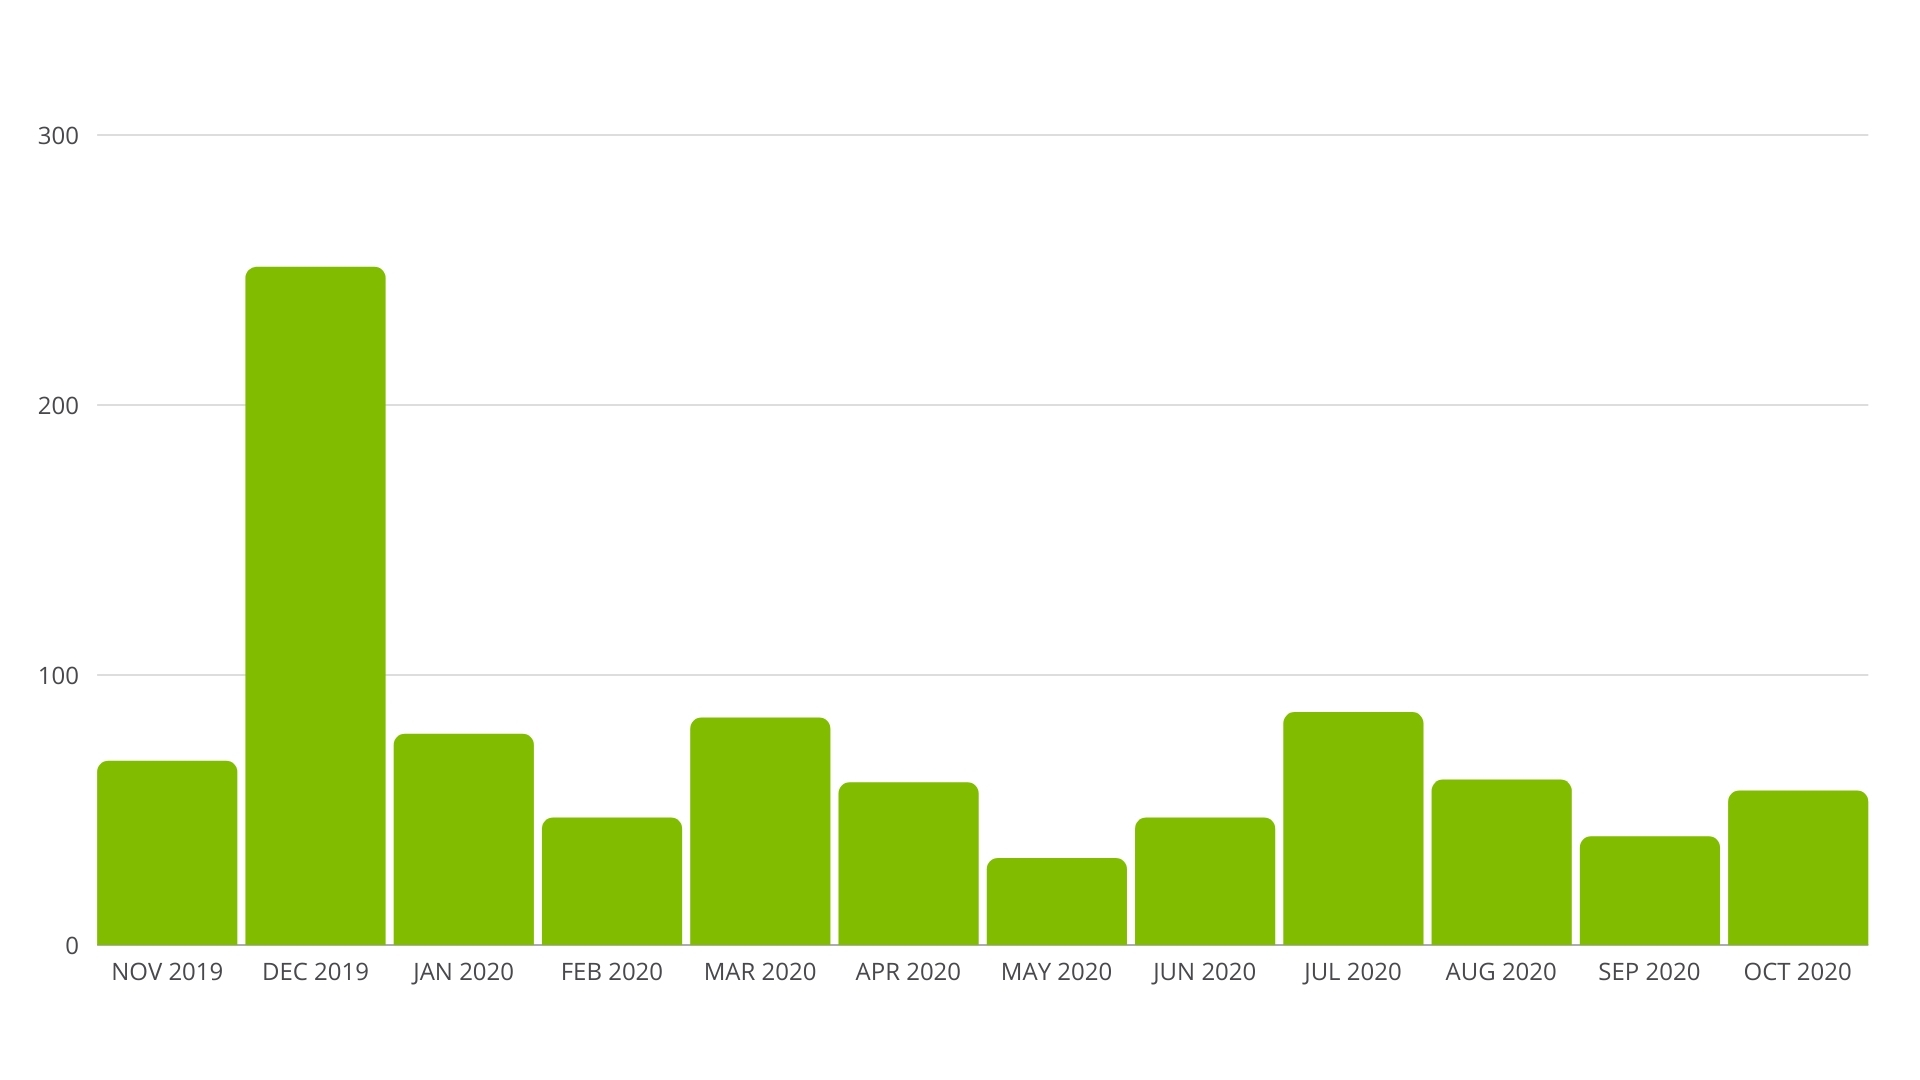
Visits have started to pick up with tree planting events starting in the fall. In the month of October, there were 8 views of the 404 Not Found page. I will do some digging to see if we have a broken link.
Page Views (October): 345
Visitors (October): 240
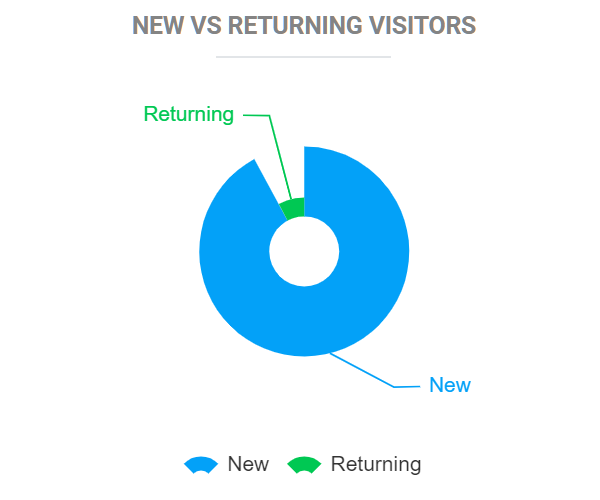
Visits to the IFGU site are often from new visitors and over 25% are coming from mobile devices and tablets. Therefore, I am planning to make the design of the site to be more ‘mobile first’.
Average time on site
The average time visitors are spending on the website is 57 seconds.
Top pages by views (November 1, 2019 – October 31, 2020)
- Invest From the Ground Up –
Growing Trees Make Great Neighborhoods – 1,436 - Home page – 290
- Trees are the Lungs of the Earth – 265
- Resources – 260
- Tree care guide and tips – 220
- San Francisco Bay Area Tree Planting Project – 213
- Great things grow on trees – 162
- 10 Myths about Trees – 162
- About Us – 1113
- Trees Mean Business – 99
Top pages by views (October 1, 2020 – September 30, 2020)
- Invest From the Ground Up –
Growing Trees Make Great Neighborhoods – 117 - Trees are the lungs of the earth – 29
- 10 myths about trees – 26
- Resources – 23
- San Francisco Bay Area Tree Planting Project – 21
- Trees mean business – 17
- Tree care guide and tips – 13
- 404 – 8
- About – 6
- CIRCLE3.0 – 5
Website performance over the past year (November 1, 2019 – October 31, 2020)
Website
Sessions:
3,169
Visitors
to Site:
2,749
Page
Views:
4,708
% New Sessions:
86%
Pages/
Session:
1.49
Avg. Time
on Site:
1m 17secs
New Sessions:
92%
Returning Sessions:
8%
Device:
Tablet 2%
Mobile 24%
Desktop 74%
